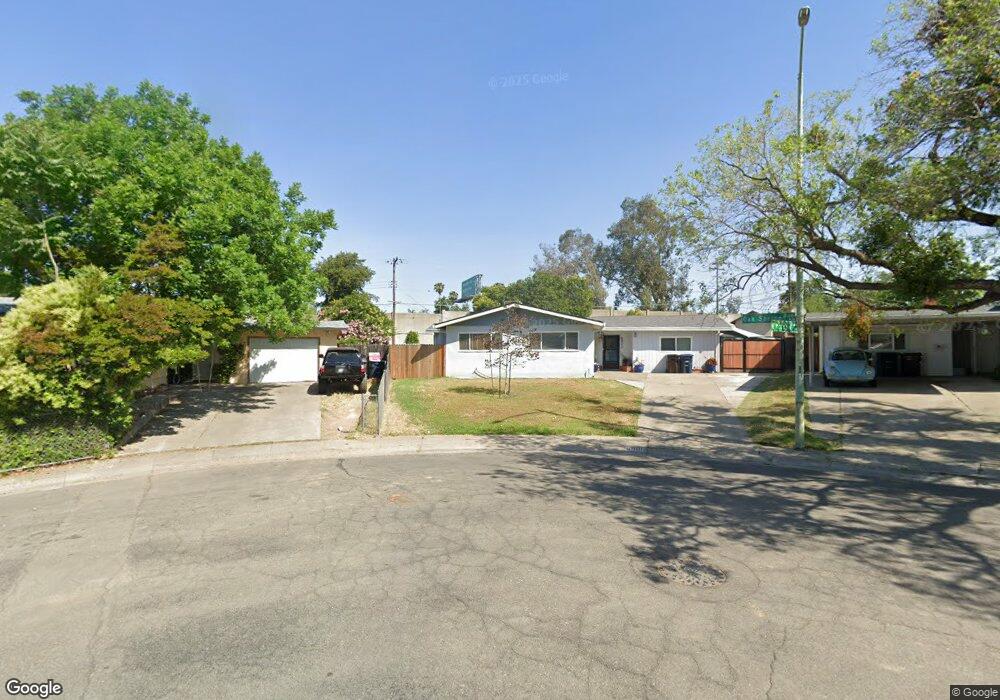
6901 Oak Spring Way Citrus Heights, CA 95621
Estimated Value: $351,000 - $513,000
4
Beds
1
Bath
1,801
Sq Ft
$238/Sq Ft
Est. Value
About This Home
This home is located at 6901 Oak Spring Way, Citrus Heights, CA 95621 and is currently estimated at $428,341, approximately $237 per square foot. 6901 Oak Spring Way is a home located in Sacramento County with nearby schools including Grand Oaks Elementary School, Sylvan Middle School, and Mesa Verde High School.
Ownership History
Date
Name
Owned For
Owner Type
Purchase Details
Closed on
Sep 19, 2002
Sold by
Hall Karen and Hall Joel P
Bought by
Hall Joel P and Hall Karen
Current Estimated Value
Home Financials for this Owner
Home Financials are based on the most recent Mortgage that was taken out on this home.
Original Mortgage
$136,500
Outstanding Balance
$56,688
Interest Rate
6.16%
Estimated Equity
$371,653
Purchase Details
Closed on
Oct 3, 2001
Sold by
Hall Karen and Nation Karen M
Bought by
Hall Joel P and Hall Karen
Home Financials for this Owner
Home Financials are based on the most recent Mortgage that was taken out on this home.
Original Mortgage
$115,000
Interest Rate
6.9%
Purchase Details
Closed on
Aug 24, 1998
Sold by
Nations Gary C
Bought by
Hall Karen
Home Financials for this Owner
Home Financials are based on the most recent Mortgage that was taken out on this home.
Original Mortgage
$19,070
Interest Rate
6.42%
Create a Home Valuation Report for This Property
The Home Valuation Report is an in-depth analysis detailing your home's value as well as a comparison with similar homes in the area
Home Values in the Area
Average Home Value in this Area
Purchase History
| Date | Buyer | Sale Price | Title Company |
|---|---|---|---|
| Hall Joel P | -- | Placer Title Company | |
| Hall Joel P | -- | Placer Title Company | |
| Hall Karen | -- | -- |
Source: Public Records
Mortgage History
| Date | Status | Borrower | Loan Amount |
|---|---|---|---|
| Open | Hall Joel P | $136,500 | |
| Closed | Hall Joel P | $115,000 | |
| Previous Owner | Hall Karen | $19,070 |
Source: Public Records
Tax History Compared to Growth
Tax History
| Year | Tax Paid | Tax Assessment Tax Assessment Total Assessment is a certain percentage of the fair market value that is determined by local assessors to be the total taxable value of land and additions on the property. | Land | Improvement |
|---|---|---|---|---|
| 2025 | $622 | $57,544 | $7,564 | $49,980 |
| 2024 | $622 | $56,416 | $7,416 | $49,000 |
| 2023 | $605 | $55,311 | $7,271 | $48,040 |
| 2022 | $600 | $54,228 | $7,129 | $47,099 |
| 2021 | $589 | $53,166 | $6,990 | $46,176 |
| 2020 | $578 | $52,622 | $6,919 | $45,703 |
| 2019 | $565 | $51,591 | $6,784 | $44,807 |
| 2018 | $557 | $50,580 | $6,651 | $43,929 |
| 2017 | $551 | $49,589 | $6,521 | $43,068 |
| 2016 | $514 | $48,618 | $6,394 | $42,224 |
| 2015 | $505 | $47,888 | $6,298 | $41,590 |
| 2014 | $493 | $46,958 | $6,178 | $40,780 |
Source: Public Records
Map
Nearby Homes
- 8001 Lichen Dr
- 6611 Branchwater Way
- 6600 Branchwater Way
- 8031 Lichen Dr
- 7783 Live Oak Way
- 7128 Parish Way
- 6633 Briartree Way
- 6721 Navion Dr
- 8206 Lichen Dr
- 7542 Pomerol Ln
- 8069 Cornerstone Way
- 7716 Las Lilas Ct
- 7325 Little Oaks Way
- 8256 Yardgate Way
- 7058 Enright Dr
- 8016 Lesser Way
- 7006 Enright Dr
- 6301 Autumn Oak Ct
- 206 Pau Hana Cir
- 77012 Lauppe Ln
- 6905 Oak Spring Way
- 6800 Birchwood Cir
- 6948 Gumwood Cir
- 6909 Oak Spring Way
- 6944 Gumwood Cir
- 6804 Birchwood Cir
- 6900 Oak Spring Way
- 6913 Oak Spring Way
- 7000 Gumwood Cir
- 6940 Gumwood Cir
- 6808 Birchwood Cir
- 6912 Oak Spring Way
- 6936 Gumwood Cir
- 6807 Birchwood Cir
- 7004 Gumwood Cir
- 6812 Birchwood Cir
- 6916 Oak Spring Way
- 7001 Gumwood Cir
- 6811 Birchwood Cir
- 6923 Oak Spring Way