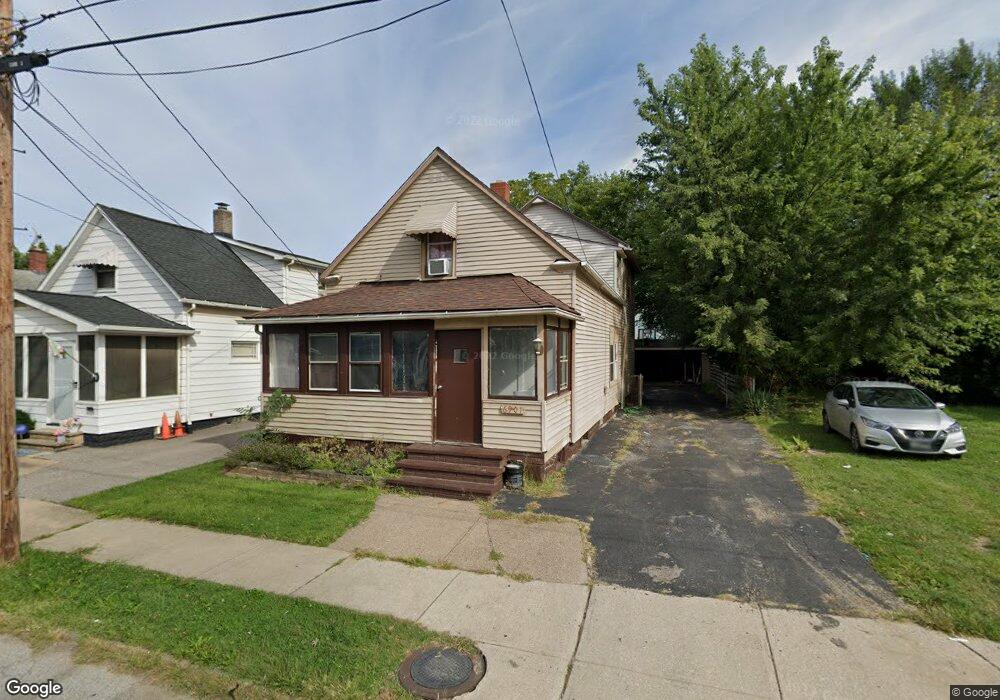
6901 Rathbun Ave Cleveland, OH 44105
Slavic Village NeighborhoodEstimated Value: $77,000 - $90,000
4
Beds
1
Bath
1,470
Sq Ft
$55/Sq Ft
Est. Value
About This Home
This home is located at 6901 Rathbun Ave, Cleveland, OH 44105 and is currently estimated at $81,462, approximately $55 per square foot. 6901 Rathbun Ave is a home located in Cuyahoga County with nearby schools including Anton Grdina School, Bolton, and Andrew J. Rickoff School.
Ownership History
Date
Name
Owned For
Owner Type
Purchase Details
Closed on
Jan 2, 2023
Sold by
Slavic Village Rentals Inc
Bought by
Alm Properties Two Inc
Current Estimated Value
Purchase Details
Closed on
Nov 27, 2020
Sold by
Just Wire Seder Properties Inc
Bought by
Slavic Village Rentals Inc
Purchase Details
Closed on
Oct 1, 2010
Sold by
Federal Home Loan Mortgage Corporation
Bought by
Seder Belaell
Purchase Details
Closed on
Jul 23, 2010
Sold by
Sorbin Sandra and Sorbin Michael
Bought by
Federal Home Loan Mortgage Corp
Purchase Details
Closed on
Aug 21, 2003
Sold by
Sorbin Cecilia L
Bought by
Sorbin Michael and Sorbin Sandra
Purchase Details
Closed on
Mar 10, 1994
Sold by
Sorbin Nick
Bought by
Sorbin Cecilia L
Purchase Details
Closed on
Aug 8, 1989
Sold by
Savage Peter M
Bought by
Sorbin Nick
Purchase Details
Closed on
Feb 9, 1989
Sold by
Savage Peter M and Savage Dorothy P
Bought by
Savage Peter M
Purchase Details
Closed on
Jan 1, 1975
Bought by
Savage Peter M and Savage Dorothy P
Create a Home Valuation Report for This Property
The Home Valuation Report is an in-depth analysis detailing your home's value as well as a comparison with similar homes in the area
Home Values in the Area
Average Home Value in this Area
Purchase History
| Date | Buyer | Sale Price | Title Company |
|---|---|---|---|
| Alm Properties Two Inc | -- | None Listed On Document | |
| Slavic Village Rentals Inc | -- | Seder Belaell A | |
| Just Wire Seder Properties Inc | -- | None Listed On Document | |
| Seder Belaell | -- | Attorney | |
| Federal Home Loan Mortgage Corp | $11,334 | None Available | |
| Sorbin Michael | -- | -- | |
| Sorbin Cecilia L | -- | -- | |
| Sorbin Nick | $27,000 | -- | |
| Savage Peter M | -- | -- | |
| Savage Peter M | -- | -- |
Source: Public Records
Tax History Compared to Growth
Tax History
| Year | Tax Paid | Tax Assessment Tax Assessment Total Assessment is a certain percentage of the fair market value that is determined by local assessors to be the total taxable value of land and additions on the property. | Land | Improvement |
|---|---|---|---|---|
| 2024 | $1,547 | $23,135 | $4,095 | $19,040 |
| 2023 | $1,145 | $14,770 | $2,870 | $11,900 |
| 2022 | $1,139 | $14,770 | $2,870 | $11,900 |
| 2021 | $1,128 | $14,770 | $2,870 | $11,900 |
| 2020 | $1,144 | $12,950 | $2,520 | $10,430 |
| 2019 | $1,059 | $37,000 | $7,200 | $29,800 |
| 2018 | $1,008 | $12,950 | $2,520 | $10,430 |
| 2017 | $968 | $11,450 | $1,610 | $9,840 |
| 2016 | $961 | $11,450 | $1,610 | $9,840 |
| 2015 | $5,132 | $11,450 | $1,610 | $9,840 |
| 2014 | $5,132 | $11,450 | $1,610 | $9,840 |
Source: Public Records
Map
Nearby Homes
- 6922 Berdelle Ave
- 4318 E 72nd St
- 7204 Alice Ave
- 4339 E 72nd St
- 4309 E 73rd St
- 7206 Deveny Ave
- 6710 Clement Ave
- 6644 Clement Ave
- 6727 Clement Ave
- 7211 Covert Ave
- 4093 E 66th St
- 7213 Park Ave
- 4101 E 64th St
- 6703 Claasen Ave
- 4067 E 68th St
- 4073 E 64th St
- 4092 E 72nd St
- 7418 Clement Ave
- 6714 Ottawa Rd
- 4346 E 77th St
- 6825 Rathbun Ave
- 6905 Rathbun Ave
- 6823 Rathbun Ave
- 6909 Rathbun Ave
- 6819 Rathbun Ave
- 6913 Rathbun Ave
- 6904 Berdelle Ave
- 6908 Berdelle Ave
- 6822 Berdelle Ave
- 6815 Rathbun Ave
- 6917 Rathbun Ave
- 6902 Rathbun Ave
- 6912 Berdelle Ave
- 6822 Rathbun Ave
- 6826 Rathbun Ave
- 6906 Rathbun Ave
- 6818 Berdelle Ave
- 6912 Rathbun Ave
- 6910 Rathbun Ave
- 6919 Rathbun Ave