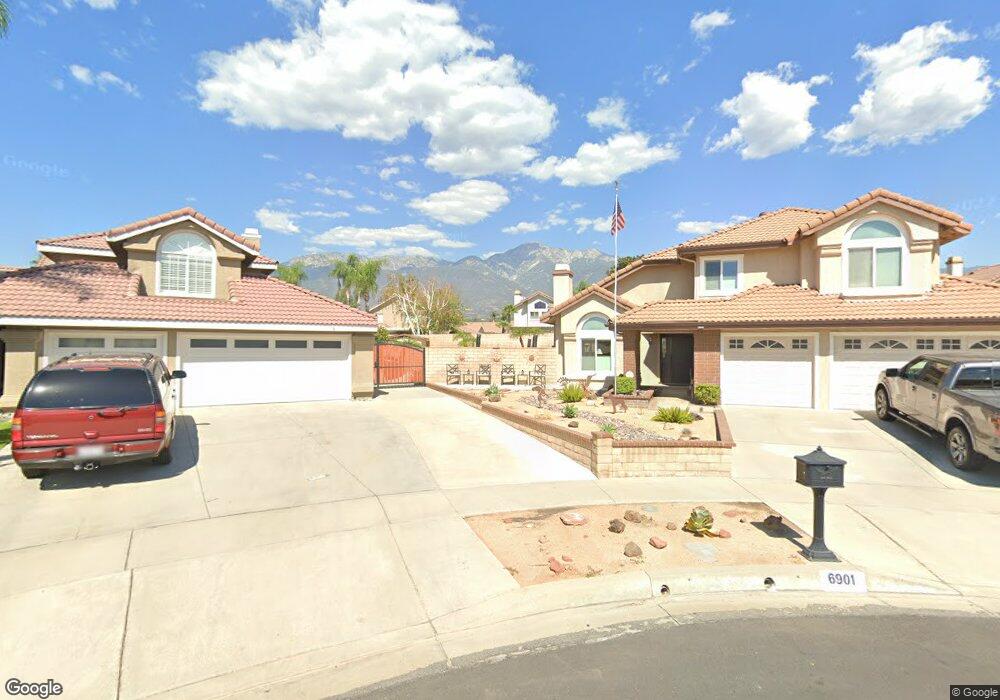
6901 Stanislaus Place Rancho Cucamonga, CA 91701
Alta Loma NeighborhoodEstimated Value: $872,895 - $964,000
3
Beds
3
Baths
1,871
Sq Ft
$482/Sq Ft
Est. Value
About This Home
This home is located at 6901 Stanislaus Place, Rancho Cucamonga, CA 91701 and is currently estimated at $902,474, approximately $482 per square foot. 6901 Stanislaus Place is a home located in San Bernardino County with nearby schools including Victoria Groves Elementary, Vineyard Junior High, and Los Osos High.
Ownership History
Date
Name
Owned For
Owner Type
Purchase Details
Closed on
Sep 24, 2011
Sold by
Durst Gregory A
Bought by
Durst Gregory A and Durst Linda
Current Estimated Value
Purchase Details
Closed on
Sep 30, 1996
Sold by
Carroll Danny L and Carroll Gale L
Bought by
Durst Gregory Allen and Durst Linda
Home Financials for this Owner
Home Financials are based on the most recent Mortgage that was taken out on this home.
Original Mortgage
$145,600
Outstanding Balance
$13,333
Interest Rate
8.06%
Estimated Equity
$889,141
Purchase Details
Closed on
Nov 23, 1994
Sold by
Texas Commerce Bank Na
Bought by
Carroll Danny L and Carroll Gale L
Home Financials for this Owner
Home Financials are based on the most recent Mortgage that was taken out on this home.
Original Mortgage
$140,000
Interest Rate
8.92%
Purchase Details
Closed on
Jan 24, 1994
Sold by
Robert E Weiss Inc
Bought by
Texas Commerce Bank National Assn
Purchase Details
Closed on
Nov 21, 1993
Sold by
Investors Mtg Holding Company
Bought by
Quality Performance Re Development Ltd and Tif Mar Ins
Create a Home Valuation Report for This Property
The Home Valuation Report is an in-depth analysis detailing your home's value as well as a comparison with similar homes in the area
Home Values in the Area
Average Home Value in this Area
Purchase History
| Date | Buyer | Sale Price | Title Company |
|---|---|---|---|
| Durst Gregory A | -- | None Available | |
| Durst Gregory Allen | $182,000 | American Title Ins Co | |
| Carroll Danny L | $175,000 | First Southwestern Title Co | |
| Texas Commerce Bank National Assn | $161,500 | Fidelity National Title Ins | |
| Quality Performance Re Development Ltd | -- | -- |
Source: Public Records
Mortgage History
| Date | Status | Borrower | Loan Amount |
|---|---|---|---|
| Open | Durst Gregory Allen | $145,600 | |
| Previous Owner | Carroll Danny L | $140,000 |
Source: Public Records
Tax History
| Year | Tax Paid | Tax Assessment Tax Assessment Total Assessment is a certain percentage of the fair market value that is determined by local assessors to be the total taxable value of land and additions on the property. | Land | Improvement |
|---|---|---|---|---|
| 2025 | $3,566 | $296,418 | $74,919 | $221,499 |
| 2024 | $3,472 | $290,606 | $73,450 | $217,156 |
| 2023 | $3,389 | $284,908 | $72,010 | $212,898 |
| 2022 | $3,370 | $279,322 | $70,598 | $208,724 |
| 2021 | $3,367 | $273,845 | $69,214 | $204,631 |
| 2020 | $3,241 | $271,037 | $68,504 | $202,533 |
| 2019 | $3,273 | $265,723 | $67,161 | $198,562 |
| 2018 | $3,205 | $260,513 | $65,844 | $194,669 |
| 2017 | $3,072 | $255,405 | $64,553 | $190,852 |
| 2016 | $2,995 | $250,397 | $63,287 | $187,110 |
| 2015 | $2,977 | $246,635 | $62,336 | $184,299 |
| 2014 | $2,908 | $241,804 | $61,115 | $180,689 |
Source: Public Records
Map
Nearby Homes
- 10830 Yolo St
- 7004 Beal Ct
- 7034 Mendocino Place
- 6592 San Benito Ave
- 11224 Amarillo St
- 6587 Shawna Ave
- 6771 Galveston Place
- 7297 Meadowlark Place
- 11320 Genova Rd
- 10456 Hamilton St
- 7323 Ambrosia Rd
- 11356 Verona Dr
- 10399 Monte Vista St
- 6598 Bradford Ct
- 7373 Glenview Place
- 10751 Spyglass Dr
- 7407 Ambrosia Rd
- 11179 Summerside Ln
- 10350 Baseline Rd Unit 55
- 10655 Lemon Ave
- 10867 Yuba Ct
- 6905 Stanislaus Place
- 10857 Yuba Ct
- 10877 Yuba Ct
- 10847 Yuba Ct
- 10846 Plumas Rd
- 10837 Yuba Ct
- 10834 Plumas Rd
- 10887 Yuba Ct
- 10824 Plumas Rd
- 6875 Trinity Place
- 6923 Stanislaus Place
- 6883 Trinity Place
- 6865 Trinity Place
- 10860 Yuba Ct
- 10870 Yuba Ct
- 10890 Yuba Ct
- 10850 Yuba Ct
- 10847 Plumas Rd
- 10880 Yuba Ct
Your Personal Tour Guide
Ask me questions while you tour the home.