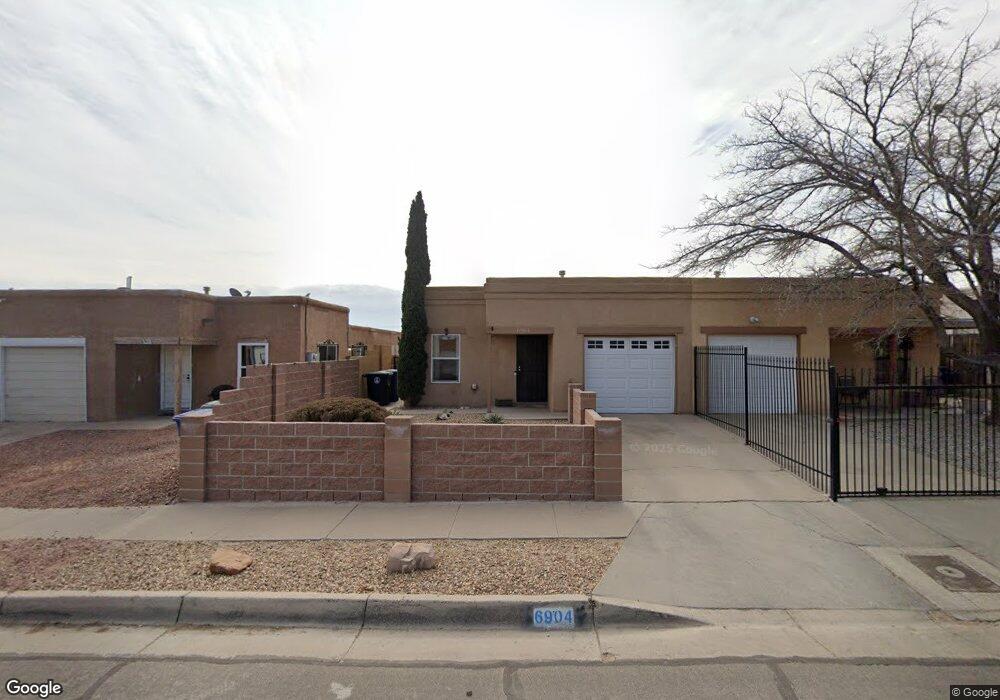
6904 Ivy Place SW Albuquerque, NM 87121
Southwest Heights NeighborhoodEstimated Value: $198,000 - $226,700
3
Beds
2
Baths
1,150
Sq Ft
$188/Sq Ft
Est. Value
About This Home
This home is located at 6904 Ivy Place SW, Albuquerque, NM 87121 and is currently estimated at $215,925, approximately $187 per square foot. 6904 Ivy Place SW is a home located in Bernalillo County with nearby schools including Alamosa Elementary School, Truman Middle School, and West Mesa High School.
Ownership History
Date
Name
Owned For
Owner Type
Purchase Details
Closed on
Jul 7, 2006
Sold by
Vega Escalante Raquel
Bought by
Rivera Andrew
Current Estimated Value
Home Financials for this Owner
Home Financials are based on the most recent Mortgage that was taken out on this home.
Original Mortgage
$96,000
Outstanding Balance
$56,629
Interest Rate
6.63%
Mortgage Type
Purchase Money Mortgage
Estimated Equity
$159,296
Purchase Details
Closed on
Apr 21, 2006
Sold by
Ruiz Leonardo L Ortega
Bought by
Vega Escalante Raquel
Purchase Details
Closed on
Jul 31, 1998
Sold by
Arguello Dorleen S and Arguello Ernestine M
Bought by
Ortega Ruiz Leonardo L and Vega Escalante Raquel T
Home Financials for this Owner
Home Financials are based on the most recent Mortgage that was taken out on this home.
Original Mortgage
$69,531
Interest Rate
6.94%
Mortgage Type
FHA
Create a Home Valuation Report for This Property
The Home Valuation Report is an in-depth analysis detailing your home's value as well as a comparison with similar homes in the area
Home Values in the Area
Average Home Value in this Area
Purchase History
| Date | Buyer | Sale Price | Title Company |
|---|---|---|---|
| Rivera Andrew | -- | First American Title Ins Co | |
| Vega Escalante Raquel | -- | None Available | |
| Ortega Ruiz Leonardo L | -- | Fidelity National Title |
Source: Public Records
Mortgage History
| Date | Status | Borrower | Loan Amount |
|---|---|---|---|
| Open | Rivera Andrew | $96,000 | |
| Previous Owner | Ortega Ruiz Leonardo L | $69,531 |
Source: Public Records
Tax History Compared to Growth
Tax History
| Year | Tax Paid | Tax Assessment Tax Assessment Total Assessment is a certain percentage of the fair market value that is determined by local assessors to be the total taxable value of land and additions on the property. | Land | Improvement |
|---|---|---|---|---|
| 2025 | $929 | $22,671 | $7,599 | $15,072 |
| 2024 | $929 | $22,010 | $7,377 | $14,633 |
| 2023 | $913 | $21,370 | $7,163 | $14,207 |
| 2022 | $882 | $20,748 | $6,954 | $13,794 |
| 2021 | $853 | $20,144 | $6,752 | $13,392 |
| 2020 | $839 | $19,557 | $6,555 | $13,002 |
| 2019 | $814 | $18,988 | $6,365 | $12,623 |
| 2018 | $785 | $18,988 | $6,365 | $12,623 |
| 2017 | $761 | $18,435 | $6,179 | $12,256 |
| 2016 | $761 | $17,898 | $5,999 | $11,899 |
| 2015 | $25,097 | $25,097 | $5,999 | $19,098 |
| 2014 | $1,066 | $25,097 | $5,999 | $19,098 |
| 2013 | -- | $25,393 | $6,673 | $18,720 |
Source: Public Records
Map
Nearby Homes
- 6436 Trujillo Rd SW
- 420 69th St SW
- 420 65th St SW
- 5948 Carlos Rey Cir SW
- 0 Bridge Blvd SW
- Payson Plan at Villa De Marcos Gabriel
- Wellton Plan at Estrella at High Range
- Mesquite Plan at Estrella at High Range
- Bisbee Plan at Estrella at High Range
- Somerton Plan at Estrella at High Range
- Bennett Plan at Estrella at High Range
- 1116 Santander St SW
- 6208 Gonzales Rd SW
- 7400 Via Sereno SW
- 220 Flip Ln SW
- 412 63rd St SW
- 7535 Via Tranquilo SW
- 7524 Via Belleza SW
- Clove Plan at Sage Park
- Cumin Plan at Sage Park
- 6908 Ivy Place SW
- 6900 Ivy Place SW
- 6834 Ivy Place SW
- 6914 Ivy Place SW
- 6918 Ivy Place SW
- 6830 Ivy Place SW
- 6909 Ivy Place SW
- 6905 Ivy Place SW
- 6901 Ivy Place SW
- 6915 Ivy Place SW
- 6826 Ivy Place SW
- 6835 Ivy Place SW
- 6922 Ivy Place SW
- 6831 Ivy Place SW
- 6926 Ivy Place SW
- 6822 Ivy Place SW
- 6827 Ivy Place SW
- 6923 Ivy Place SW
- 6818 Ivy Place SW
- 6823 Ivy Place SW