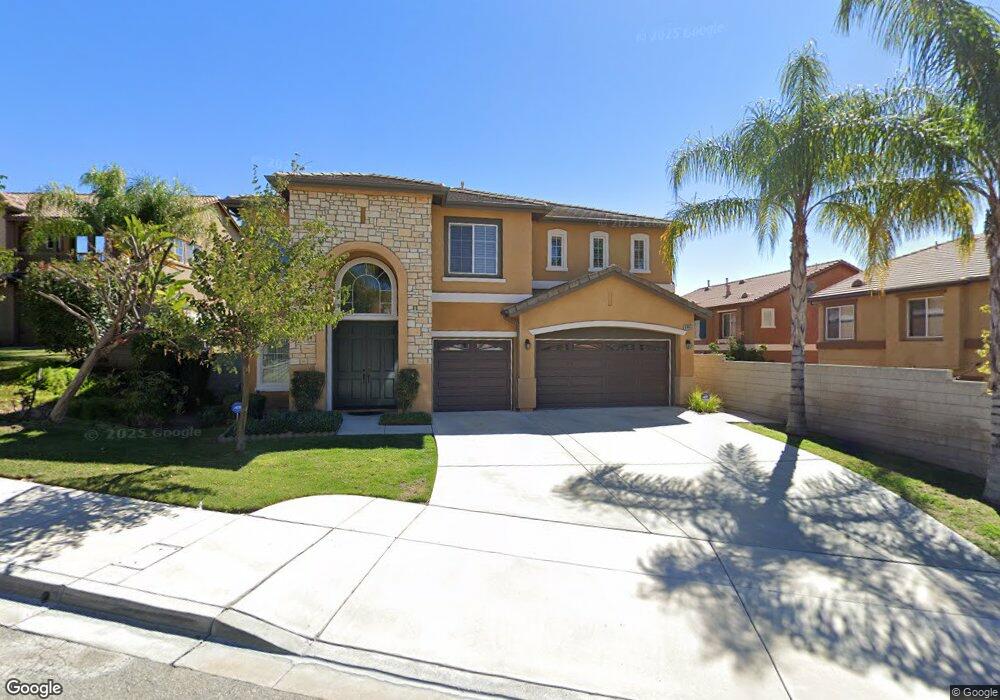
6905 Bacon Ln Highland, CA 92346
East Highlands NeighborhoodEstimated Value: $775,811 - $1,002,000
4
Beds
4
Baths
3,825
Sq Ft
$234/Sq Ft
Est. Value
About This Home
This home is located at 6905 Bacon Ln, Highland, CA 92346 and is currently estimated at $894,453, approximately $233 per square foot. 6905 Bacon Ln is a home located in San Bernardino County with nearby schools including Cram Elementary School, Beattie Middle School, and Citrus Valley High School.
Ownership History
Date
Name
Owned For
Owner Type
Purchase Details
Closed on
Nov 29, 2021
Sold by
Gonzalez Giancarlo and Gonzalez Susan V
Bought by
Gonzalez Giancarlo and Gonzalez Susan V
Current Estimated Value
Purchase Details
Closed on
Jan 26, 2013
Sold by
Gonzalez Giancarlo and Gonzalez Susan V
Bought by
Gonzalez Giancarlo and Gonzalez Susan V
Home Financials for this Owner
Home Financials are based on the most recent Mortgage that was taken out on this home.
Original Mortgage
$397,842
Outstanding Balance
$277,599
Interest Rate
3.37%
Mortgage Type
FHA
Estimated Equity
$616,854
Purchase Details
Closed on
Mar 4, 2004
Sold by
Gonzalez Giancarlo and Gonzalez Susan V
Bought by
Gonzalez Giancarlo and Gonzalez Susan V
Purchase Details
Closed on
Dec 18, 2002
Sold by
Centex Homes
Bought by
Gonzalez Giancarlo and Gonzalez Susan V
Home Financials for this Owner
Home Financials are based on the most recent Mortgage that was taken out on this home.
Original Mortgage
$277,684
Interest Rate
5.86%
Create a Home Valuation Report for This Property
The Home Valuation Report is an in-depth analysis detailing your home's value as well as a comparison with similar homes in the area
Home Values in the Area
Average Home Value in this Area
Purchase History
| Date | Buyer | Sale Price | Title Company |
|---|---|---|---|
| Gonzalez Giancarlo | -- | None Available | |
| Gonzalez Giancarlo | -- | Placer Title Company | |
| Gonzalez Giancarlo | -- | -- | |
| Gonzalez Giancarlo | $347,500 | Commerce Title Company |
Source: Public Records
Mortgage History
| Date | Status | Borrower | Loan Amount |
|---|---|---|---|
| Open | Gonzalez Giancarlo | $397,842 | |
| Closed | Gonzalez Giancarlo | $277,684 | |
| Closed | Gonzalez Giancarlo | $52,065 |
Source: Public Records
Tax History Compared to Growth
Tax History
| Year | Tax Paid | Tax Assessment Tax Assessment Total Assessment is a certain percentage of the fair market value that is determined by local assessors to be the total taxable value of land and additions on the property. | Land | Improvement |
|---|---|---|---|---|
| 2025 | $7,936 | $502,725 | $86,901 | $415,824 |
| 2024 | $7,936 | $492,868 | $85,197 | $407,671 |
| 2023 | $7,896 | $483,203 | $83,526 | $399,677 |
| 2022 | $7,771 | $473,728 | $81,888 | $391,840 |
| 2021 | $7,801 | $464,439 | $80,282 | $384,157 |
| 2020 | $7,666 | $459,677 | $79,459 | $380,218 |
| 2019 | $7,454 | $450,664 | $77,901 | $372,763 |
| 2018 | $7,217 | $441,828 | $76,374 | $365,454 |
| 2017 | $6,889 | $433,164 | $74,876 | $358,288 |
| 2016 | $6,799 | $424,671 | $73,408 | $351,263 |
| 2015 | $6,731 | $418,292 | $72,305 | $345,987 |
| 2014 | $6,608 | $410,099 | $70,889 | $339,210 |
Source: Public Records
Map
Nearby Homes
- 6858 Bacon Ln
- 29301 Henderson Ln
- 0 Cloverhill Dr
- 29367 Lytle Ln
- 29045 Horner Ln
- 28947 Glenrock Place
- 29029 Easton Ln
- 29346 Crest View Ln
- 7154 Paul Green Dr
- 7163 Paul Green Dr
- 7184 Veranda Ln
- 7188 Veranda Ln
- 7192 Veranda Ln
- 7196 Veranda Ln
- 7202 Veranda Ln
- 7183 Veranda Ln
- 7206 Veranda Ln
- 7214 Veranda Ln
- Plan Three at Highland Park
- Plan One at Highland Park
- 6897 Bacon Ln
- 29200 Clear Spring Ln
- 29206 Clear Spring Ln
- 6881 Bacon Ln
- 6924 Clear Spring Ct
- 6916 Clear Spring Ct
- 6898 Bacon Ln
- 6930 Clear Spring Ct
- 6908 Bacon Ln
- 6884 Bacon Ln
- 6920 Bacon Ln
- 6910 Clear Spring Ct
- 29197 Clear Spring Ln
- 29185 Clear Spring Ln
- 29179 Clear Spring Ln
- 29215 Clear Spring Ln
- 29227 Clear Spring Ln
- 6866 Bacon Ln
- 6933 Clear Spring Ct
- 6921 Clear Spring Ct