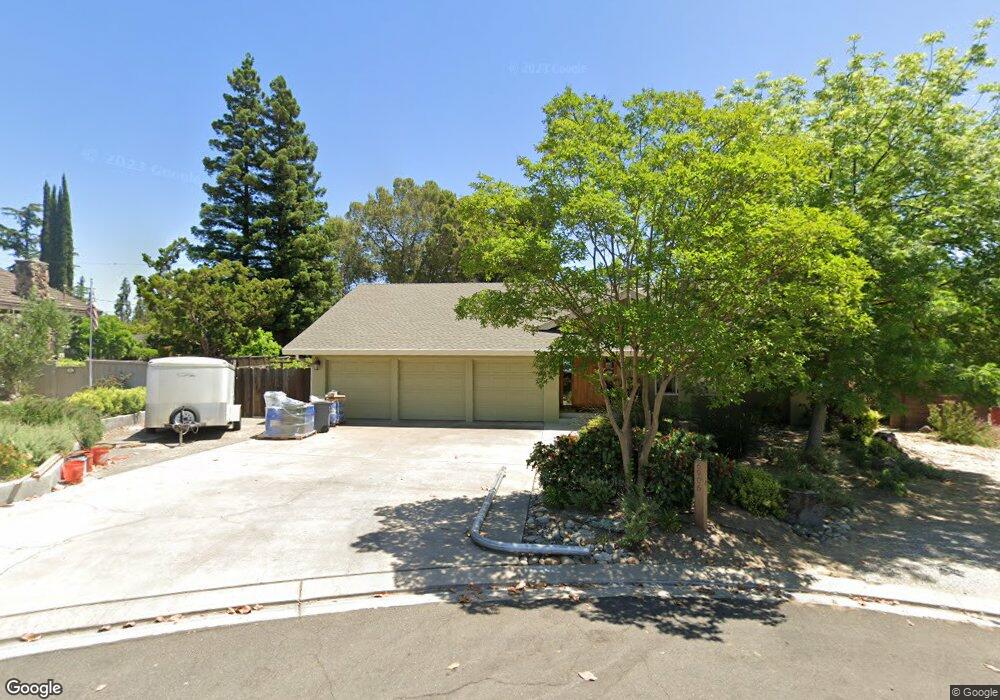
6906 S Park Ridge Ct Riverbank, CA 95367
River Cove NeighborhoodEstimated Value: $373,000 - $747,129
4
Beds
3
Baths
3,190
Sq Ft
$172/Sq Ft
Est. Value
About This Home
This home is located at 6906 S Park Ridge Ct, Riverbank, CA 95367 and is currently estimated at $547,282, approximately $171 per square foot. 6906 S Park Ridge Ct is a home located in Stanislaus County with nearby schools including Stanislaus Elementary School, Prescott Junior High School, and Fred C. Beyer High School.
Ownership History
Date
Name
Owned For
Owner Type
Purchase Details
Closed on
Mar 23, 2021
Sold by
Hansen David Lowe
Bought by
Hansen David L and Hansen Ellen M
Current Estimated Value
Purchase Details
Closed on
Feb 15, 2012
Sold by
Meek Jadene A
Bought by
Hansen David Lowe
Purchase Details
Closed on
Feb 21, 2006
Sold by
Meek Michael L and Meek Dawn L
Bought by
Meek Jadene A
Home Financials for this Owner
Home Financials are based on the most recent Mortgage that was taken out on this home.
Original Mortgage
$300,000
Interest Rate
7%
Mortgage Type
Negative Amortization
Purchase Details
Closed on
Jan 16, 2003
Sold by
Meek Jadene Ann
Bought by
Meek Michael L and Meek Dawn L
Home Financials for this Owner
Home Financials are based on the most recent Mortgage that was taken out on this home.
Original Mortgage
$250,000
Interest Rate
5.96%
Create a Home Valuation Report for This Property
The Home Valuation Report is an in-depth analysis detailing your home's value as well as a comparison with similar homes in the area
Home Values in the Area
Average Home Value in this Area
Purchase History
| Date | Buyer | Sale Price | Title Company |
|---|---|---|---|
| Hansen David L | -- | None Available | |
| Hansen David Lowe | $176,500 | None Available | |
| Meek Jadene A | -- | First American Title Company | |
| Meek Michael L | -- | Fidelity National Title |
Source: Public Records
Mortgage History
| Date | Status | Borrower | Loan Amount |
|---|---|---|---|
| Previous Owner | Meek Jadene A | $300,000 | |
| Previous Owner | Meek Michael L | $250,000 |
Source: Public Records
Tax History Compared to Growth
Tax History
| Year | Tax Paid | Tax Assessment Tax Assessment Total Assessment is a certain percentage of the fair market value that is determined by local assessors to be the total taxable value of land and additions on the property. | Land | Improvement |
|---|---|---|---|---|
| 2025 | $3,776 | $317,763 | $119,318 | $198,445 |
| 2024 | $3,702 | $311,533 | $116,979 | $194,554 |
| 2023 | $3,627 | $305,426 | $114,686 | $190,740 |
| 2022 | $3,482 | $299,438 | $112,438 | $187,000 |
| 2021 | $3,417 | $293,568 | $110,234 | $183,334 |
| 2020 | $3,362 | $290,559 | $109,104 | $181,455 |
| 2019 | $3,296 | $284,863 | $106,965 | $177,898 |
| 2018 | $3,227 | $279,278 | $104,868 | $174,410 |
| 2017 | $3,147 | $273,803 | $102,812 | $170,991 |
| 2016 | $3,121 | $268,436 | $100,797 | $167,639 |
| 2015 | $3,078 | $264,404 | $99,283 | $165,121 |
| 2014 | $3,066 | $259,226 | $97,339 | $161,887 |
Source: Public Records
Map
Nearby Homes
- 2166 Park Ridge Dr
- 6606 Candlewood Cir
- 2137 Candlewood Place
- 2219 Candlewood Place
- 2107 Patterson Rd Unit 41
- 2107 Patterson Rd Unit 40
- 2013 Khatri Ct
- 2307 Candlewood Place
- 6713 Estelle Ave
- 1806 Hot Springs Ln
- 2325 Rio Verde Dr
- 6625 River Mesa Dr
- 2324 Colony Manor Dr
- 2160 Southgate Dr
- 6500 Jackson Ave
- 2255 Patterson Rd
- 2167 Morrill Rd
- 2173 Morrill Rd
- 2667 Patterson Rd
- 2530 Dobbins Ln
- 6900 S Park Ridge Ct
- 6912 S Park Ridge Ct
- 2019 River Heights Dr
- 2013 River Heights Dr
- 2007 River Heights Dr
- 6901 S Park Ridge Ct
- 2128 Park Ridge Dr
- 2130 Park Ridge Dr
- 6907 S Park Ridge Ct
- 2025 River Heights Dr
- 2001 River Heights Dr
- 2124 Park Ridge Dr
- 2031 River Heights Dr
- 6909 S Park Ridge Ct
- 2006 River Heights Dr
- 2012 River Heights Dr
- 6734 Woodhaven Place
- 6737 Woodhaven Place
- 6743 Lynch Ave
- 2018 River Heights Dr