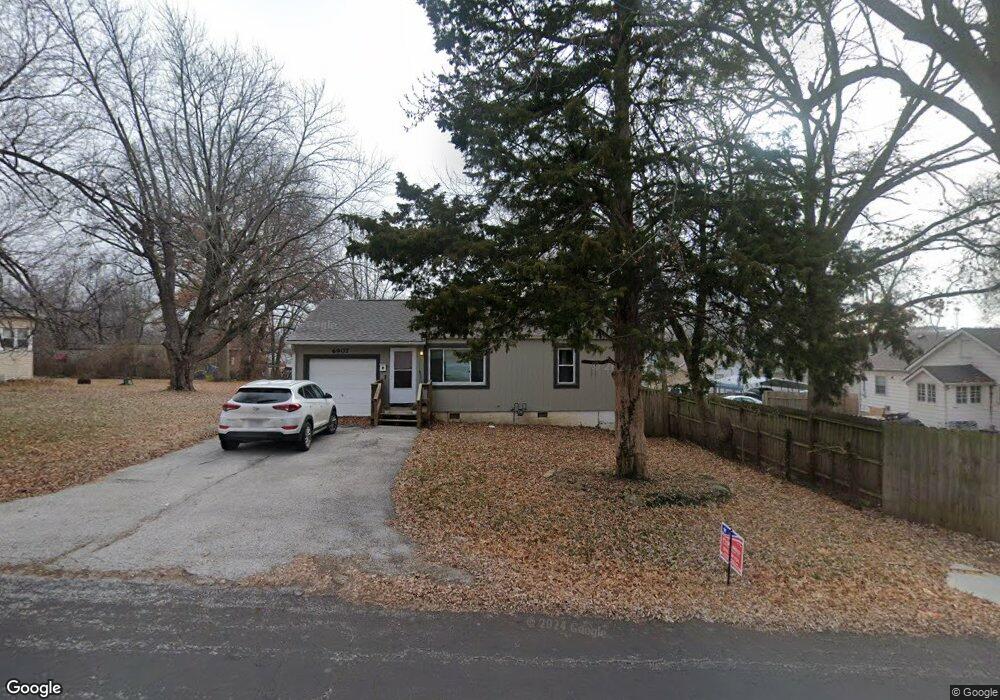
6907 Laurel Ave Raytown, MO 64133
Estimated Value: $120,000 - $145,000
2
Beds
1
Bath
780
Sq Ft
$169/Sq Ft
Est. Value
About This Home
This home is located at 6907 Laurel Ave, Raytown, MO 64133 and is currently estimated at $131,533, approximately $168 per square foot. 6907 Laurel Ave is a home located in Jackson County with nearby schools including Blue Ridge Elementary School, Raytown Central Middle School, and Carver Christian Academy.
Ownership History
Date
Name
Owned For
Owner Type
Purchase Details
Closed on
Jun 8, 2006
Sold by
Pound Richard E and Pound Cheryl A
Bought by
Pound Properties Llc
Current Estimated Value
Purchase Details
Closed on
Mar 16, 2001
Sold by
Hud
Bought by
Pound Richard E and Pound Cheryl M
Purchase Details
Closed on
Dec 11, 2000
Sold by
Bank Of Oklahoma Na
Bought by
Hud
Purchase Details
Closed on
Nov 30, 2000
Sold by
Baker John W
Bought by
Bank Of Oklahoma and Banc Oklahoma Mtg Corp
Purchase Details
Closed on
Sep 18, 1997
Sold by
Sec Of Housing & Urban Dev
Bought by
Baker John W
Home Financials for this Owner
Home Financials are based on the most recent Mortgage that was taken out on this home.
Original Mortgage
$38,650
Interest Rate
7.59%
Mortgage Type
FHA
Purchase Details
Closed on
Apr 2, 1997
Sold by
Wesley T Kozeny Trustee Corp
Bought by
Hud
Create a Home Valuation Report for This Property
The Home Valuation Report is an in-depth analysis detailing your home's value as well as a comparison with similar homes in the area
Home Values in the Area
Average Home Value in this Area
Purchase History
| Date | Buyer | Sale Price | Title Company |
|---|---|---|---|
| Pound Properties Llc | -- | None Available | |
| Pound Richard E | -- | Premier Title Company | |
| Hud | -- | First American Title Ins | |
| Bank Of Oklahoma | $40,647 | First American Title Ins | |
| Baker John W | -- | -- | |
| Hud | $34,031 | -- |
Source: Public Records
Mortgage History
| Date | Status | Borrower | Loan Amount |
|---|---|---|---|
| Previous Owner | Baker John W | $38,650 |
Source: Public Records
Tax History
| Year | Tax Paid | Tax Assessment Tax Assessment Total Assessment is a certain percentage of the fair market value that is determined by local assessors to be the total taxable value of land and additions on the property. | Land | Improvement |
|---|---|---|---|---|
| 2025 | $1,231 | $13,317 | $2,958 | $10,359 |
| 2024 | $1,223 | $13,648 | $2,637 | $11,011 |
| 2023 | $1,223 | $13,648 | $1,621 | $12,027 |
| 2022 | $947 | $10,070 | $2,932 | $7,138 |
| 2021 | $951 | $10,070 | $2,932 | $7,138 |
| 2020 | $1,062 | $11,140 | $2,932 | $8,208 |
| 2019 | $1,056 | $11,140 | $2,932 | $8,208 |
| 2018 | $887 | $9,695 | $2,552 | $7,143 |
| 2017 | $887 | $9,695 | $2,552 | $7,143 |
| 2016 | $860 | $9,452 | $2,544 | $6,908 |
Source: Public Records
Map
Nearby Homes
- 6824 Laurel Ave
- 8500 E State Route 350
- 9314 E 68th Terrace
- 6924 Hunter St
- 7300 Elm Ave
- 7317 Elm Ave
- 9609 E 68th St
- 7209 Oxford Ave
- 9005 E 73rd St
- 9005 E 74th St
- 9804 E 68 St
- 9705 E Gregory Blvd
- 9304 Vaughn Ave
- 8809 E 73rd St
- 8920 Rose Ln
- 9616 E 66th St
- 7005 Raytown Rd
- 9202 E 64th Terrace
- 10005 E 69th Terrace
- 8510 E 71st Terrace
- 6903 Laurel Ave
- 9102 E 69th Terrace
- 9103 E 69th St
- 9100 E 69th Terrace
- 6901 Laurel Ave
- 9104 E 69th Terrace
- 6912 Laurel Ave
- 6906 Laurel Ave
- 9105 E 69th St
- 6900 Laurel Ave
- 9106 E 69th Terrace
- 9107 E 69th St
- 6925 Laurel Ave
- 6916 Laurel Ave
- 6833 Laurel Ave
- 9110 E 69th St
- 9103 E 69th Terrace
- 9108 E 69th Terrace
- 9007 E 69th St
- 9108 E 69th St
Your Personal Tour Guide
Ask me questions while you tour the home.