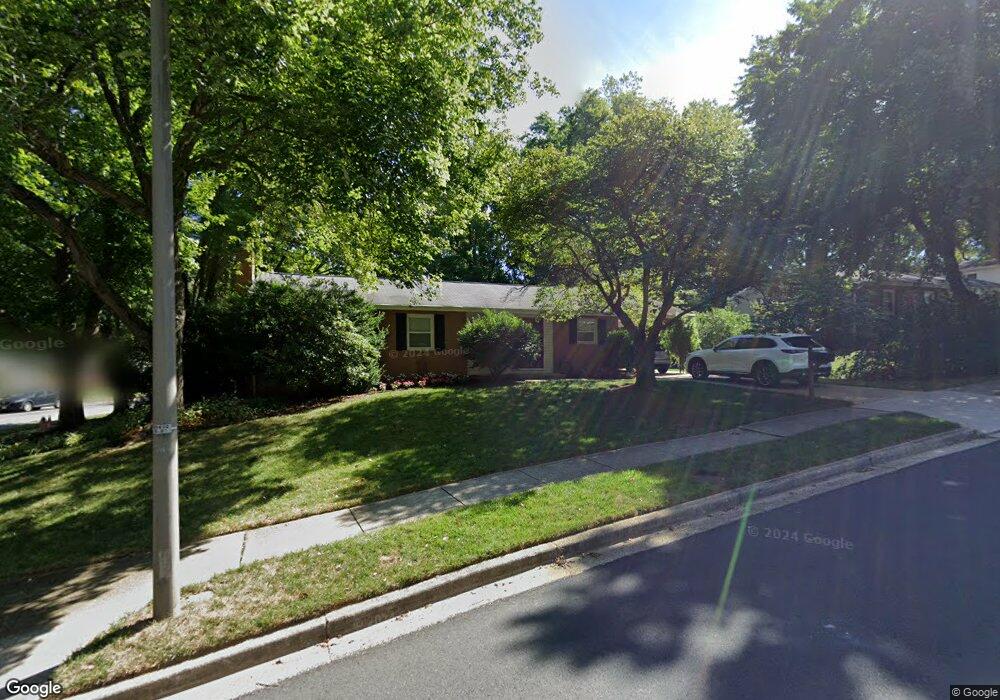
6909 Gillings Rd Springfield, VA 22152
Estimated Value: $766,000 - $816,000
5
Beds
3
Baths
1,344
Sq Ft
$587/Sq Ft
Est. Value
About This Home
This home is located at 6909 Gillings Rd, Springfield, VA 22152 and is currently estimated at $789,235, approximately $587 per square foot. 6909 Gillings Rd is a home located in Fairfax County with nearby schools including Hunt Valley Elementary School, Irving Middle School, and West Springfield High School.
Ownership History
Date
Name
Owned For
Owner Type
Purchase Details
Closed on
Feb 16, 2024
Sold by
Swiergosz Matthew J and Swiergosz Lori D
Bought by
Swiergosz Revocable Trust and Swiergosz
Current Estimated Value
Purchase Details
Closed on
Mar 31, 2008
Sold by
Spindler Mark S
Bought by
Swiergosz Matthew J
Home Financials for this Owner
Home Financials are based on the most recent Mortgage that was taken out on this home.
Original Mortgage
$445,450
Interest Rate
5.76%
Mortgage Type
New Conventional
Purchase Details
Closed on
Aug 25, 1998
Sold by
Pierce Samuel M
Bought by
Spinder Mark S
Home Financials for this Owner
Home Financials are based on the most recent Mortgage that was taken out on this home.
Original Mortgage
$203,000
Interest Rate
6.86%
Create a Home Valuation Report for This Property
The Home Valuation Report is an in-depth analysis detailing your home's value as well as a comparison with similar homes in the area
Home Values in the Area
Average Home Value in this Area
Purchase History
| Date | Buyer | Sale Price | Title Company |
|---|---|---|---|
| Swiergosz Revocable Trust | -- | None Listed On Document | |
| Swiergosz Matthew J | $442,500 | -- | |
| Spinder Mark S | $203,000 | -- |
Source: Public Records
Mortgage History
| Date | Status | Borrower | Loan Amount |
|---|---|---|---|
| Previous Owner | Swiergosz Matthew J | $445,450 | |
| Previous Owner | Spinder Mark S | $203,000 |
Source: Public Records
Tax History
| Year | Tax Paid | Tax Assessment Tax Assessment Total Assessment is a certain percentage of the fair market value that is determined by local assessors to be the total taxable value of land and additions on the property. | Land | Improvement |
|---|---|---|---|---|
| 2025 | $7,850 | $741,870 | $255,000 | $486,870 |
| 2024 | $7,850 | $677,570 | $225,000 | $452,570 |
| 2023 | $7,537 | $667,910 | $225,000 | $442,910 |
| 2022 | $7,130 | $623,530 | $215,000 | $408,530 |
| 2021 | $6,502 | $554,100 | $190,000 | $364,100 |
| 2020 | $6,287 | $531,180 | $185,000 | $346,180 |
| 2019 | $6,129 | $517,870 | $185,000 | $332,870 |
| 2018 | $5,707 | $496,280 | $185,000 | $311,280 |
| 2017 | $5,637 | $485,520 | $180,000 | $305,520 |
| 2016 | $5,299 | $457,370 | $170,000 | $287,370 |
Source: Public Records
Map
Nearby Homes
- 8600 Kentford Dr
- 8615 Kerry Ln
- 6819 Lavant Dr
- 6708 Portree Ct
- 8703 Etta Dr
- 8705 Side Saddle Rd
- 8714 Arley Dr
- 7115 Hundsford Ln
- 8805 Aquary Ct
- 7229 Olde Lantern Way
- 8739 Arley Dr
- 6410 Wyngate Dr
- 6815 Rolling Rd
- 0 Edge Creek Ln
- 6606 Huntsman Blvd
- 8733 Cuttermill Place
- 6607 Grey Fox Dr
- 6901 Huntsman Blvd
- 8118 Viola St
- 8816 Arley Dr
- 6906 Ashbury Dr
- 6911 Gillings Rd
- 6908 Gillings Rd
- 6910 Ashbury Dr
- 6910 Gillings Rd
- 6905 Gillings Rd
- 6913 Gillings Rd
- 6903 Ashbury Dr
- 6906 Gillings Rd
- 6905 Ashbury Dr
- 6912 Ashbury Dr
- 6912 Gillings Rd
- 6907 Ashbury Dr
- 8514 Fairburn Dr
- 6904 Gillings Rd
- 6915 Gillings Rd
- 6914 Ashbury Dr
- 8516 Fairburn Dr
- 6909 Ashbury Dr
- 8512 Fairburn Dr
Your Personal Tour Guide
Ask me questions while you tour the home.