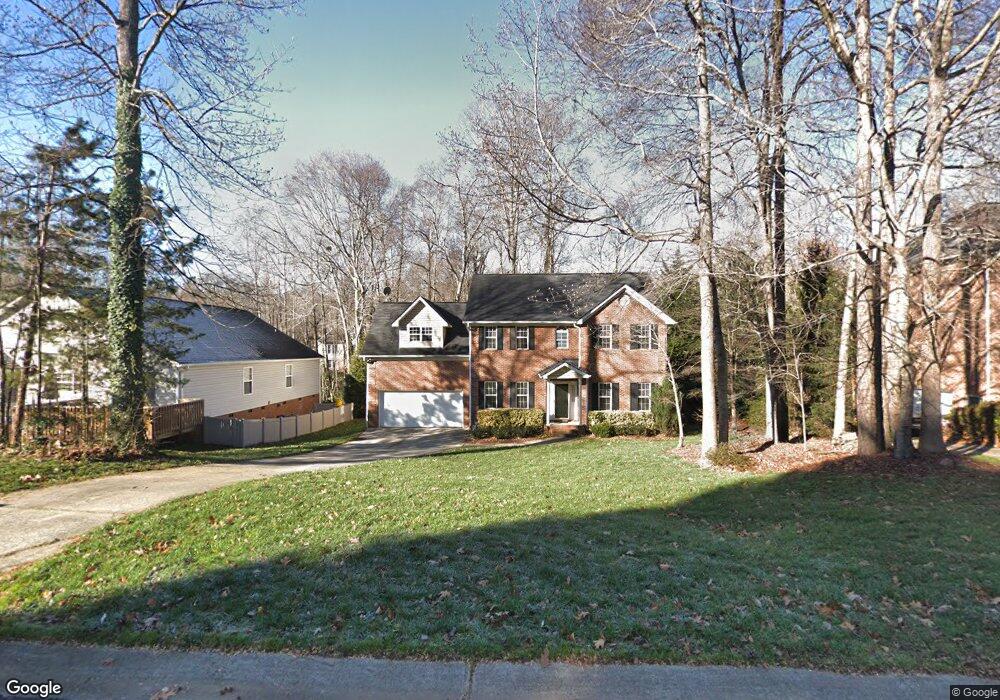
6909 Loretta Place Charlotte, NC 28215
Silverwood NeighborhoodEstimated Value: $430,000 - $570,000
3
Beds
3
Baths
2,478
Sq Ft
$192/Sq Ft
Est. Value
About This Home
This home is located at 6909 Loretta Place, Charlotte, NC 28215 and is currently estimated at $476,308, approximately $192 per square foot. 6909 Loretta Place is a home located in Mecklenburg County with nearby schools including Northridge Middle School, Rocky River High School, and Charlotte Choice Charter.
Ownership History
Date
Name
Owned For
Owner Type
Purchase Details
Closed on
Nov 13, 2012
Sold by
Samuels Linda
Bought by
Whiteside Linda and Whiteside Perry
Current Estimated Value
Purchase Details
Closed on
Mar 21, 2003
Sold by
Emc Mortgage Corp
Bought by
Samuels Linda
Home Financials for this Owner
Home Financials are based on the most recent Mortgage that was taken out on this home.
Original Mortgage
$157,600
Interest Rate
5.74%
Mortgage Type
Purchase Money Mortgage
Purchase Details
Closed on
Jul 30, 2002
Sold by
Roberts Lea
Bought by
Emc Mtg Corp
Purchase Details
Closed on
Feb 19, 1998
Sold by
Vaneyken Leisha C and Vaneyken Leslie T
Bought by
Roberts Lea
Home Financials for this Owner
Home Financials are based on the most recent Mortgage that was taken out on this home.
Original Mortgage
$173,000
Interest Rate
8.75%
Mortgage Type
Purchase Money Mortgage
Purchase Details
Closed on
Nov 20, 1997
Sold by
Bonita Homes Llc
Bought by
Vaneyken Leisha C
Home Financials for this Owner
Home Financials are based on the most recent Mortgage that was taken out on this home.
Original Mortgage
$148,500
Interest Rate
7.27%
Mortgage Type
Purchase Money Mortgage
Create a Home Valuation Report for This Property
The Home Valuation Report is an in-depth analysis detailing your home's value as well as a comparison with similar homes in the area
Home Values in the Area
Average Home Value in this Area
Purchase History
| Date | Buyer | Sale Price | Title Company |
|---|---|---|---|
| Whiteside Linda | -- | None Available | |
| Samuels Linda | $166,000 | -- | |
| Emc Mtg Corp | $137,292 | -- | |
| Roberts Lea | $165,000 | -- | |
| Vaneyken Leisha C | $165,000 | -- |
Source: Public Records
Mortgage History
| Date | Status | Borrower | Loan Amount |
|---|---|---|---|
| Previous Owner | Samuels Linda | $157,600 | |
| Previous Owner | Roberts Lea | $173,000 | |
| Previous Owner | Vaneyken Leisha C | $148,500 | |
| Closed | Vaneyken Leisha C | $8,250 |
Source: Public Records
Tax History Compared to Growth
Tax History
| Year | Tax Paid | Tax Assessment Tax Assessment Total Assessment is a certain percentage of the fair market value that is determined by local assessors to be the total taxable value of land and additions on the property. | Land | Improvement |
|---|---|---|---|---|
| 2025 | $2,972 | $372,200 | $110,400 | $261,800 |
| 2024 | $2,972 | $372,200 | $110,400 | $261,800 |
| 2023 | $2,869 | $372,200 | $110,400 | $261,800 |
| 2022 | $2,250 | $220,200 | $38,000 | $182,200 |
| 2021 | $2,239 | $220,200 | $38,000 | $182,200 |
| 2020 | $2,232 | $220,200 | $38,000 | $182,200 |
| 2019 | $2,216 | $220,200 | $38,000 | $182,200 |
| 2018 | $2,508 | $185,600 | $37,000 | $148,600 |
| 2017 | $2,465 | $185,600 | $37,000 | $148,600 |
| 2016 | $2,456 | $185,600 | $37,000 | $148,600 |
| 2015 | $2,444 | $185,600 | $37,000 | $148,600 |
| 2014 | -- | $185,600 | $37,000 | $148,600 |
Source: Public Records
Map
Nearby Homes
- 6930 Albaneen Ct
- 6824 Silverwood Ln
- 7932 Sir Barton Ct Unit 93
- 6514 Alanbrook Rd
- The Rembert Plan at Clairmont
- The Santee Plan at Clairmont
- The Bancroft Plan at Clairmont
- The Lambert Plan at Clairmont
- The Arline Plan at Clairmont
- The Idlewild Plan at Clairmont
- The Hazelwood Plan at Clairmont
- The Shiloh Plan at Clairmont
- 7400 Plott Rd
- 6938 Ludell Ln
- 6857 Parkers Crossing Dr
- 7021 Fauna Dr
- 6641 Lakeside Dr
- 6410 Windsor Gate Ln
- 6319 Windsor Gate Ln Unit 6319
- 7015 Lavern St
- 6903 Loretta Place
- 6915 Loretta Place
- 6921 Loretta Place
- 6908 Albaneen Ct
- 6900 Albaneen Ct
- 6821 Loretta Place
- 6821 Loretta Place Unit 24
- 6912 Albaneen Ct
- 6927 Loretta Place
- 6912 Loretta Place
- 6906 Loretta Place
- 6920 Albaneen Ct
- 6900 Loretta Place
- 6815 Loretta Place
- 6924 Loretta Place
- 6931 Loretta Place
- 6930 Albaneen Ct Unit 19
- 6822 Loretta Place
- 6900 Silverwood Ln
- 6934 Albaneen Ct