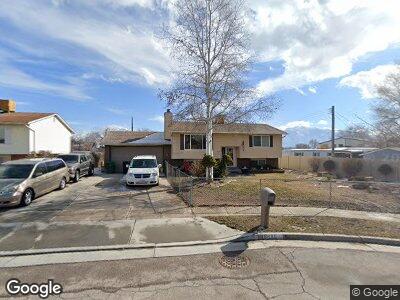
6909 S McNae Way West Jordan, UT 84084
Estimated Value: $449,000 - $479,075
4
Beds
1
Bath
1,936
Sq Ft
$239/Sq Ft
Est. Value
About This Home
This home is located at 6909 S McNae Way, West Jordan, UT 84084 and is currently estimated at $462,519, approximately $238 per square foot. 6909 S McNae Way is a home located in Salt Lake County with nearby schools including Heartland Elementary School, West Jordan Middle School, and West Jordan High School.
Ownership History
Date
Name
Owned For
Owner Type
Purchase Details
Closed on
Jun 27, 2011
Sold by
Arellano Gabriela L and Arellano Steven M
Bought by
Arellano Steven M
Current Estimated Value
Purchase Details
Closed on
Jun 23, 2010
Sold by
Vargas Ronnie
Bought by
Arellano Gabriela L and Arellano Steven M
Home Financials for this Owner
Home Financials are based on the most recent Mortgage that was taken out on this home.
Original Mortgage
$153,886
Interest Rate
4.87%
Mortgage Type
FHA
Purchase Details
Closed on
Oct 16, 2002
Sold by
Mciff Steven L and Mciff Sharron P
Bought by
Vargas Ronnie
Home Financials for this Owner
Home Financials are based on the most recent Mortgage that was taken out on this home.
Original Mortgage
$128,976
Interest Rate
6.05%
Mortgage Type
FHA
Create a Home Valuation Report for This Property
The Home Valuation Report is an in-depth analysis detailing your home's value as well as a comparison with similar homes in the area
Home Values in the Area
Average Home Value in this Area
Purchase History
| Date | Buyer | Sale Price | Title Company |
|---|---|---|---|
| Arellano Steven M | -- | Advanced Title Slc | |
| Arellano Gabriela L | -- | Equity Title | |
| Vargas Ronnie | -- | Equity Title |
Source: Public Records
Mortgage History
| Date | Status | Borrower | Loan Amount |
|---|---|---|---|
| Open | Arellano Steven M | $224,000 | |
| Closed | Arellano Steven M | $37,500 | |
| Closed | Arellano Gabriela L | $153,886 | |
| Previous Owner | Vargas Ronnie | $23,000 | |
| Previous Owner | Vargas Ronnie | $128,976 |
Source: Public Records
Tax History Compared to Growth
Tax History
| Year | Tax Paid | Tax Assessment Tax Assessment Total Assessment is a certain percentage of the fair market value that is determined by local assessors to be the total taxable value of land and additions on the property. | Land | Improvement |
|---|---|---|---|---|
| 2023 | $2,063 | $374,100 | $121,600 | $252,500 |
| 2022 | $2,156 | $384,700 | $119,300 | $265,400 |
| 2021 | $1,898 | $308,300 | $91,600 | $216,700 |
| 2020 | $1,772 | $270,100 | $79,200 | $190,900 |
| 2019 | $1,603 | $239,600 | $79,200 | $160,400 |
| 2018 | $1,463 | $216,800 | $75,700 | $141,100 |
| 2017 | $1,349 | $199,100 | $75,700 | $123,400 |
| 2016 | $1,287 | $178,500 | $75,700 | $102,800 |
| 2015 | $1,363 | $184,300 | $80,800 | $103,500 |
| 2014 | $1,223 | $162,800 | $72,100 | $90,700 |
Source: Public Records
Map
Nearby Homes
- 1292 Bateman Ponds Way
- 1320 W 6690 S Unit C104
- 1400 W 6690 S Unit G201
- 1285 W Winchester St Unit 2
- 1272 W Overlook Point Place
- 6744 S Saddle Bluff Dr
- 1392 W Wallsburg Dr
- 6594 S 1300 W
- 1169 W Bateman Point Dr
- 1501 Culpepper Cir
- 7094 S 1205 W
- 1244 Murray Bluffs Ct
- 6861 S Triumph Ln
- 6872 S Triumph Ln
- 6802 S Triumph Ln
- 6496 S 1140 W
- 6381 S 1300 W
- 6472 S 1040 W
- 6268 S Faber Ln
- 1689 Crystal Ridge Dr
- 6909 S McNae Way
- 6909 McNae Way
- 6887 McNae Way
- 6887 S McNae Way
- 6882 S Columbia Dr
- 1386 W 6915 S
- 6876 S Columbia Dr
- 6865 McNae Way
- 6866 McNae Way
- 6877 S Columbia Dr
- 6915 Columbia Dr
- 6831 S McNae Way
- 1255 W 6850 S
- 1285 W 6850 S
- 6824 S Anderson Way
- 1399 W 6915 S
- 6845 McNae Way
- 6854 S Anderson Way Unit 62
- 6854 S Anderson Way
- 1399 W 6850 S