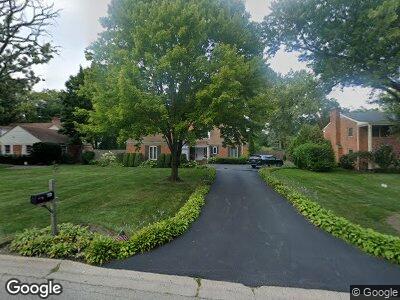
691 Beverly Place Lake Forest, IL 60045
Estimated Value: $816,000 - $1,088,000
4
Beds
3
Baths
2,145
Sq Ft
$437/Sq Ft
Est. Value
About This Home
This home is located at 691 Beverly Place, Lake Forest, IL 60045 and is currently estimated at $937,440, approximately $437 per square foot. 691 Beverly Place is a home located in Lake County with nearby schools including Cherokee Elementary School, Deer Path Middle School East, and Lake Forest High School.
Ownership History
Date
Name
Owned For
Owner Type
Purchase Details
Closed on
Aug 1, 2003
Sold by
Arthur Bengree Jones Jr Declaration Of T
Bought by
Lyon George M and Lyon Ann L
Current Estimated Value
Home Financials for this Owner
Home Financials are based on the most recent Mortgage that was taken out on this home.
Original Mortgage
$320,000
Interest Rate
4.12%
Mortgage Type
Unknown
Purchase Details
Closed on
Nov 8, 1999
Sold by
Jones Arthur B and Jones Joy Marie
Bought by
Declar Jones Jr Arthur B and Arthur Bengree Jones Jr Declaration Of T
Purchase Details
Closed on
Oct 1, 1997
Sold by
Harstad Jayne A
Bought by
Jones Arthur R
Home Financials for this Owner
Home Financials are based on the most recent Mortgage that was taken out on this home.
Original Mortgage
$365,600
Interest Rate
7.25%
Purchase Details
Closed on
Jan 23, 1993
Sold by
Helene Wasynchuk Irene Olga and Helene Wasynchuk
Bought by
Harsted Jayne
Create a Home Valuation Report for This Property
The Home Valuation Report is an in-depth analysis detailing your home's value as well as a comparison with similar homes in the area
Home Values in the Area
Average Home Value in this Area
Purchase History
| Date | Buyer | Sale Price | Title Company |
|---|---|---|---|
| Lyon George M | $700,000 | -- | |
| Declar Jones Jr Arthur B | -- | -- | |
| Jones Arthur R | $304,666 | Burnet Title Llc | |
| Harsted Jayne | $250,000 | -- |
Source: Public Records
Mortgage History
| Date | Status | Borrower | Loan Amount |
|---|---|---|---|
| Open | Lyon George M | $510,400 | |
| Closed | Lyon George M | $525,000 | |
| Closed | Lyon George M | $536,000 | |
| Closed | Lyon George M | $135,000 | |
| Previous Owner | Lyon George M | $320,000 | |
| Previous Owner | Jones Arthur R | $365,600 |
Source: Public Records
Tax History Compared to Growth
Tax History
| Year | Tax Paid | Tax Assessment Tax Assessment Total Assessment is a certain percentage of the fair market value that is determined by local assessors to be the total taxable value of land and additions on the property. | Land | Improvement |
|---|---|---|---|---|
| 2024 | $13,793 | $257,401 | $113,377 | $144,024 |
| 2023 | $13,260 | $220,559 | $97,149 | $123,410 |
| 2022 | $13,260 | $220,977 | $102,294 | $118,683 |
| 2021 | $12,543 | $213,051 | $98,625 | $114,426 |
| 2020 | $12,217 | $213,500 | $98,833 | $114,667 |
| 2019 | $11,805 | $213,137 | $98,665 | $114,472 |
| 2018 | $12,088 | $231,687 | $103,706 | $127,981 |
| 2017 | $11,968 | $230,948 | $103,375 | $127,573 |
| 2016 | $11,609 | $222,215 | $99,466 | $122,749 |
| 2015 | $11,464 | $208,790 | $93,457 | $115,333 |
| 2014 | $11,163 | $211,791 | $94,125 | $117,666 |
| 2012 | $10,785 | $209,923 | $93,295 | $116,628 |
Source: Public Records
Map
Nearby Homes
- 725 Timber Ln
- 598 Rockefeller Rd
- 887 Timber Ln
- 524 Forest Hill Rd
- 715 Linden Ave
- 805 Longwood Dr
- 360 Linden Ave
- 475 Red Fox Ln
- 995 Waveland Rd
- 360 Hickory Ct
- 1171 Beverly Place
- 825 Highview Terrace
- 845 Highview Terrace
- 971 Ashley Rd
- 200 Glenwood Rd
- 631 Northmoor Rd
- 1010 Ashley Rd
- 471 Butler Dr Unit 2
- 1085 E Ringwood Rd S
- 262 E Foster Place
- 691 Beverly Place
- 681 Beverly Place Unit 4
- 709 Beverly Place
- 723 Beverly Place Unit 4
- 671 Beverly Place Unit 4
- 657 Glenwood Rd
- 644 Glenwood Rd
- 651 Beverly Place Unit 4
- 737 Beverly Place
- 726 Beverly Place
- 664 Beverly Place Unit 4
- 639 Glenwood Rd
- 736 Beverly Place
- 741 Beverly Place
- 635 Beverly Place Unit 4
- 650 Beverly Place
- 631 Glenwood Rd
- 752 Beverly Place
- 761 Beverly Place
- 625 Beverly Place