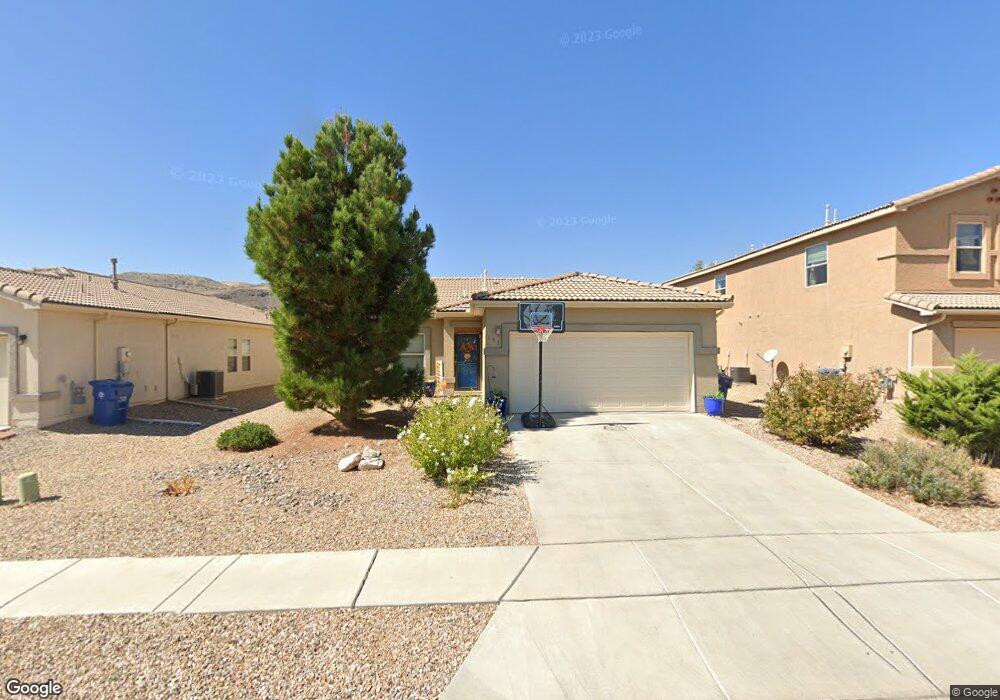
691 Creekside Ave SW Los Lunas, NM 87031
West Los Lunas NeighborhoodEstimated Value: $260,000 - $296,000
3
Beds
2
Baths
1,364
Sq Ft
$206/Sq Ft
Est. Value
About This Home
This home is located at 691 Creekside Ave SW, Los Lunas, NM 87031 and is currently estimated at $280,991, approximately $206 per square foot. 691 Creekside Ave SW is a home located in Valencia County with nearby schools including Sundance Elementary School, Los Lunas Middle School, and Los Lunas High School.
Ownership History
Date
Name
Owned For
Owner Type
Purchase Details
Closed on
Jan 11, 2022
Sold by
Leanna Karly and Leanna Mark
Bought by
Leanna Karly
Current Estimated Value
Home Financials for this Owner
Home Financials are based on the most recent Mortgage that was taken out on this home.
Original Mortgage
$157,000
Outstanding Balance
$144,695
Interest Rate
3.11%
Mortgage Type
New Conventional
Estimated Equity
$136,296
Purchase Details
Closed on
May 21, 2019
Sold by
Griffith Leanna Karly and Griffith Karly
Bought by
Griffith Leanna Karly and Griffith Leanna Mark
Home Financials for this Owner
Home Financials are based on the most recent Mortgage that was taken out on this home.
Original Mortgage
$127,200
Interest Rate
4.1%
Mortgage Type
New Conventional
Purchase Details
Closed on
Mar 24, 2010
Sold by
Centex Homes
Bought by
Griffith Karly
Home Financials for this Owner
Home Financials are based on the most recent Mortgage that was taken out on this home.
Original Mortgage
$131,020
Interest Rate
4.93%
Mortgage Type
New Conventional
Create a Home Valuation Report for This Property
The Home Valuation Report is an in-depth analysis detailing your home's value as well as a comparison with similar homes in the area
Home Values in the Area
Average Home Value in this Area
Purchase History
| Date | Buyer | Sale Price | Title Company |
|---|---|---|---|
| Leanna Karly | -- | Timios | |
| Griffith Leanna Karly | -- | Timios Inc | |
| Griffith Karly | -- | -- |
Source: Public Records
Mortgage History
| Date | Status | Borrower | Loan Amount |
|---|---|---|---|
| Open | Leanna Karly | $157,000 | |
| Closed | Griffith Leanna Karly | $127,200 | |
| Closed | Griffith Karly | $131,020 |
Source: Public Records
Tax History Compared to Growth
Tax History
| Year | Tax Paid | Tax Assessment Tax Assessment Total Assessment is a certain percentage of the fair market value that is determined by local assessors to be the total taxable value of land and additions on the property. | Land | Improvement |
|---|---|---|---|---|
| 2024 | $1,915 | $57,831 | $11,449 | $46,382 |
| 2023 | $1,847 | $56,147 | $11,322 | $44,825 |
| 2022 | $1,817 | $54,512 | $11,087 | $43,425 |
| 2021 | $1,780 | $52,923 | $10,927 | $41,996 |
| 2020 | $1,762 | $51,382 | $10,609 | $40,773 |
| 2019 | $1,771 | $51,382 | $10,609 | $40,773 |
| 2018 | $1,740 | $51,382 | $10,609 | $40,773 |
| 2017 | $1,697 | $50,888 | $10,609 | $40,279 |
| 2016 | $1,650 | $49,406 | $10,609 | $38,797 |
| 2015 | -- | $47,967 | $10,609 | $37,358 |
| 2013 | -- | $45,214 | $10,609 | $34,605 |
| 2011 | -- | $131,691 | $30,900 | $100,791 |
Source: Public Records
Map
Nearby Homes
- 750 Creekside Ave SW
- 3198 Prairie Ridge St SW
- 3271 Prairie Ridge St SW
- 760 Blue Sage Ave SW
- 680 Purple Aster Ave SW
- 2981 Desert Sage Ave SW
- 355 Black Hat Ave SW
- Sandia Plan at The Trails at El Cerro
- Bandera Plan at The Trails at El Cerro
- Alameda Plan at The Trails at El Cerro
- Manzano Plan at The Trails at El Cerro
- 275 Cloud View Ave SW
- 3700 Santa fe Trail SW
- 3461 Lonetree St SW
- 3540 High Plains St SW
- 1100 Vista de Bosque SW
- Paloma Plan at The Bluffs at El Cerro
- Mariposa Plan at The Bluffs at El Cerro
- Aguila Plan at The Bluffs at El Cerro
- 3771 Santa fe Trail SW
- 681 Creekside Ave SW
- 701 Creekside Ave SW
- 661 Creekside Ave SW
- 711 Creekside Ave SW
- 3260 Camp Fire St
- 3270 Camp Fire St
- 3284 Campfire St
- 3240 Campfire St
- 641 Creekside Ave SW
- 721 Creekside Ave SW
- 3286 Camp Fire St
- 690 Creekside Ave SW
- 3286 Campfire St
- 700 Creekside Ave SW
- 680 Creekside Ave SW
- 3230 Campfire St
- 710 Creekside Ave SW
- 3230 Camp Fire St
- 621 Creekside Ave SW
- 660 Creekside Ave SW