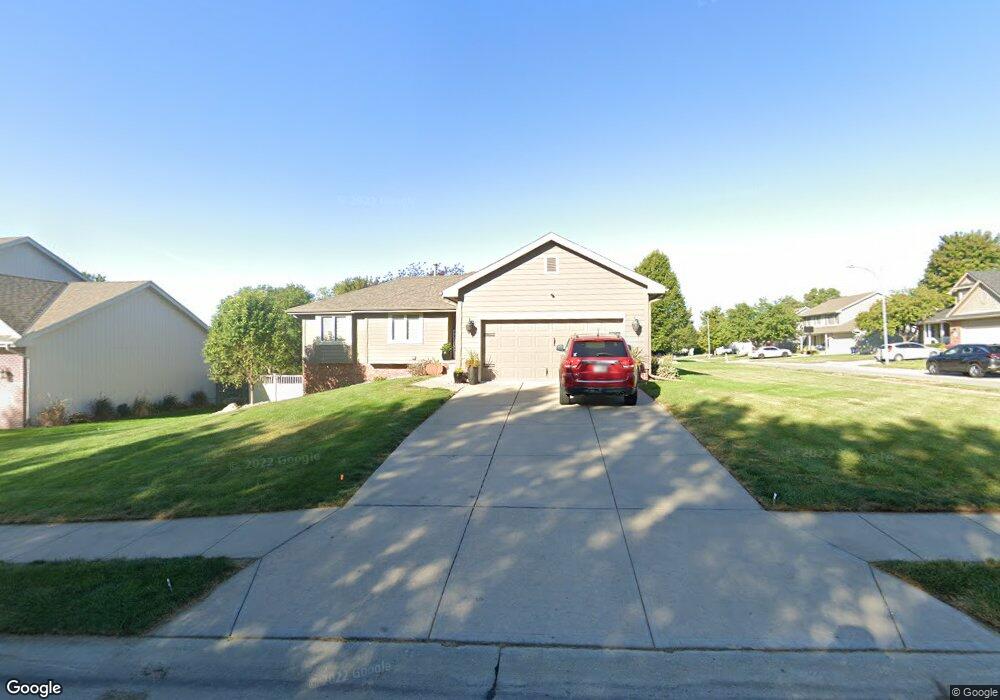
6910 S 157th St Omaha, NE 68136
Millard Park NeighborhoodEstimated Value: $349,536 - $415,000
3
Beds
4
Baths
1,410
Sq Ft
$265/Sq Ft
Est. Value
About This Home
This home is located at 6910 S 157th St, Omaha, NE 68136 and is currently estimated at $373,884, approximately $265 per square foot. 6910 S 157th St is a home located in Sarpy County with nearby schools including Black Elk Elementary School, Beadle Middle School, and Millard West High School.
Ownership History
Date
Name
Owned For
Owner Type
Purchase Details
Closed on
Dec 1, 2020
Sold by
Boston Rick and Boston Mary Lynne
Bought by
Boston Rick and Boston Mary Lynne
Current Estimated Value
Home Financials for this Owner
Home Financials are based on the most recent Mortgage that was taken out on this home.
Original Mortgage
$131,000
Outstanding Balance
$116,837
Interest Rate
2.8%
Mortgage Type
New Conventional
Estimated Equity
$257,047
Purchase Details
Closed on
Nov 1, 2000
Sold by
Prairie Homes Inc
Bought by
Boston Rick
Home Financials for this Owner
Home Financials are based on the most recent Mortgage that was taken out on this home.
Original Mortgage
$130,900
Interest Rate
7.86%
Purchase Details
Closed on
Aug 3, 2000
Sold by
Millard Park Limited Partnership
Bought by
Prairie Homes Inc
Home Financials for this Owner
Home Financials are based on the most recent Mortgage that was taken out on this home.
Original Mortgage
$130,900
Interest Rate
8.21%
Mortgage Type
Construction
Create a Home Valuation Report for This Property
The Home Valuation Report is an in-depth analysis detailing your home's value as well as a comparison with similar homes in the area
Home Values in the Area
Average Home Value in this Area
Purchase History
| Date | Buyer | Sale Price | Title Company |
|---|---|---|---|
| Boston Rick | -- | Omaha National Title & Escrow | |
| Boston Rick | $164,000 | -- | |
| Prairie Homes Inc | $21,000 | -- |
Source: Public Records
Mortgage History
| Date | Status | Borrower | Loan Amount |
|---|---|---|---|
| Open | Boston Rick | $131,000 | |
| Previous Owner | Boston Rick | $130,900 | |
| Previous Owner | Prairie Homes Inc | $130,900 |
Source: Public Records
Tax History Compared to Growth
Tax History
| Year | Tax Paid | Tax Assessment Tax Assessment Total Assessment is a certain percentage of the fair market value that is determined by local assessors to be the total taxable value of land and additions on the property. | Land | Improvement |
|---|---|---|---|---|
| 2025 | $5,664 | $340,285 | $59,000 | $281,285 |
| 2024 | $6,039 | $329,730 | $59,000 | $270,730 |
| 2023 | $6,039 | $297,012 | $47,000 | $250,012 |
| 2022 | $5,666 | $261,415 | $45,000 | $216,415 |
| 2021 | $5,486 | $250,371 | $42,000 | $208,371 |
| 2020 | $5,380 | $242,749 | $42,000 | $200,749 |
| 2019 | $5,748 | $234,534 | $42,000 | $192,534 |
| 2018 | $5,470 | $221,986 | $35,000 | $186,986 |
| 2017 | $5,301 | $209,470 | $31,000 | $178,470 |
| 2016 | $5,057 | $198,762 | $31,000 | $167,762 |
| 2015 | $4,823 | $188,601 | $31,000 | $157,601 |
| 2014 | $4,752 | $185,385 | $31,000 | $154,385 |
| 2012 | -- | $185,626 | $31,000 | $154,626 |
Source: Public Records
Map
Nearby Homes
- 7011 S 156th Avenue Cir
- 6441 S 159th Ave
- 6916 S 154th St
- 7006 S 154th St
- 16113 Josephine St
- 6212 S 158th St
- 15818 Timberlane Dr
- 16108 Adams St
- 6505 S 154th St
- 15534 Newell St
- 6735 S 153rd Cir
- 6009 S 158th St
- 16130 Timberlane Dr
- 6001 S 160th St
- 16125 Timberlane Dr
- 15219 Madison St
- 15713 Willow St
- 16112 Cottonwood Ave
- 7824 S 159th St
- 7730 S 161st Terrace
- 6914 S 157th St
- 15707 Audrey St
- 7002 S 157th St
- 15704 Audrey St
- 15711 Audrey St
- 15708 Audrey St
- 15706 Emiline St
- 15712 Audrey St
- 15715 Audrey St
- 15710 Emiline St
- 7006 S 157th St
- 7001 S 157th St
- 6909 S 157th St
- 15816 Audrey St
- 7003 S 157th St
- 15814 Emiline St
- 7005 S 157th St
- 15820 Audrey St
- 15819 Audrey St
- 7007 S 157th St