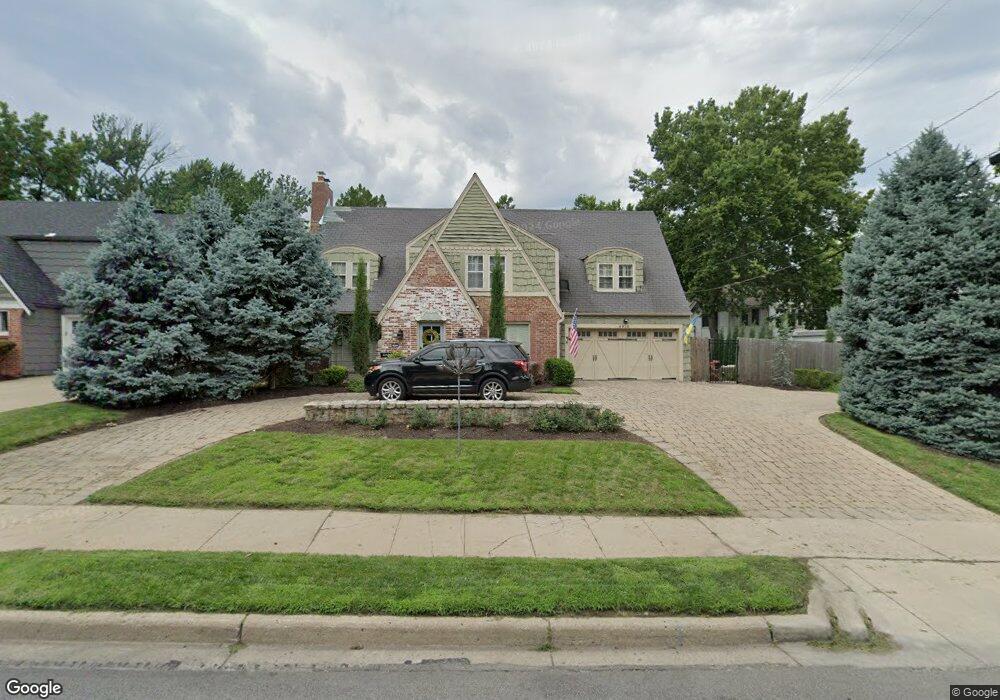
6910 Wornall Rd Kansas City, MO 64113
Armour Fields NeighborhoodEstimated Value: $604,000 - $681,000
3
Beds
4
Baths
2,410
Sq Ft
$265/Sq Ft
Est. Value
About This Home
This home is located at 6910 Wornall Rd, Kansas City, MO 64113 and is currently estimated at $639,265, approximately $265 per square foot. 6910 Wornall Rd is a home located in Jackson County with nearby schools including Hale Cook Elementary, Central Middle School, and Southeast High School.
Ownership History
Date
Name
Owned For
Owner Type
Purchase Details
Closed on
Sep 18, 2006
Sold by
Wilkins Thomas L
Bought by
Wilkins Thomas L and Wilkins Jody
Current Estimated Value
Home Financials for this Owner
Home Financials are based on the most recent Mortgage that was taken out on this home.
Original Mortgage
$308,000
Outstanding Balance
$129,273
Interest Rate
1.5%
Mortgage Type
Stand Alone Refi Refinance Of Original Loan
Estimated Equity
$509,992
Purchase Details
Closed on
Jun 22, 2000
Sold by
Berndt Kenneth D
Bought by
Wilkins Thomas L
Home Financials for this Owner
Home Financials are based on the most recent Mortgage that was taken out on this home.
Original Mortgage
$231,600
Interest Rate
8.31%
Mortgage Type
Balloon
Purchase Details
Closed on
Aug 17, 1999
Bought by
Berndt Kenneth D
Home Financials for this Owner
Home Financials are based on the most recent Mortgage that was taken out on this home.
Original Mortgage
$88,650
Interest Rate
7.71%
Mortgage Type
New Conventional
Purchase Details
Closed on
Dec 11, 1997
Sold by
Bowman Richard E and Bowman Velma F
Bought by
Bowman Richard E
Create a Home Valuation Report for This Property
The Home Valuation Report is an in-depth analysis detailing your home's value as well as a comparison with similar homes in the area
Home Values in the Area
Average Home Value in this Area
Purchase History
| Date | Buyer | Sale Price | Title Company |
|---|---|---|---|
| Wilkins Thomas L | -- | Ctic | |
| Wilkins Thomas L | -- | Chicago Title Co | |
| Berndt Kenneth D | -- | -- | |
| Bowman Richard E | -- | -- |
Source: Public Records
Mortgage History
| Date | Status | Borrower | Loan Amount |
|---|---|---|---|
| Open | Wilkins Thomas L | $308,000 | |
| Closed | Wilkins Thomas L | $231,600 | |
| Previous Owner | Berndt Kenneth D | $88,650 |
Source: Public Records
Tax History Compared to Growth
Tax History
| Year | Tax Paid | Tax Assessment Tax Assessment Total Assessment is a certain percentage of the fair market value that is determined by local assessors to be the total taxable value of land and additions on the property. | Land | Improvement |
|---|---|---|---|---|
| 2025 | $7,723 | $89,955 | $36,588 | $53,367 |
| 2024 | $7,723 | $97,850 | $17,326 | $80,524 |
| 2023 | $7,650 | $97,850 | $17,326 | $80,524 |
| 2022 | $5,595 | $68,020 | $35,776 | $32,244 |
| 2021 | $5,576 | $68,020 | $35,776 | $32,244 |
| 2020 | $5,277 | $63,570 | $35,776 | $27,794 |
| 2019 | $5,167 | $63,570 | $35,776 | $27,794 |
| 2018 | $4,931 | $61,946 | $19,930 | $42,016 |
| 2017 | $4,931 | $61,946 | $19,930 | $42,016 |
| 2016 | $4,834 | $60,394 | $19,535 | $40,859 |
| 2014 | $4,754 | $59,209 | $19,152 | $40,057 |
Source: Public Records
Map
Nearby Homes
- 6840 Wornall Rd
- 409 W 70th St
- 6848 Edgevale Rd
- 214 W 70th St
- 441 W 68th Terrace
- 7027 Brookside Rd
- 428 W 68 St
- 11 W 70th St
- 110 W 68th St
- 615 W 67th Terrace
- 619 W 67th Terrace
- 441 W 67th St
- 6908 Valley Rd
- 7105 Summit St
- 7135 Jefferson St
- 7135 Main St
- 221 E Winthrope Rd
- 7220 Wyandotte St
- 7208 Madison Ave
- 7305 Washington St
- 6922 Wornall Rd
- 6911 Edgevale Rd
- 6915 Edgevale Rd
- 6919 Edgevale Rd
- 6928 Wornall Rd
- 6923 Edgevale Rd
- 6934 Wornall Rd
- 6925 Edgevale Rd
- 132 W 69th Terrace
- 6901 Brookside Rd
- 6927 Edgevale Rd
- 6920 Edgevale Rd
- 412 W 69th St
- 6924 Edgevale Rd
- 418 W 69th St
- 6940 Wornall Rd
- 410 W 70th St
- 129 W 69th St
- 416 W 70th St
- 6921 Brookside Rd