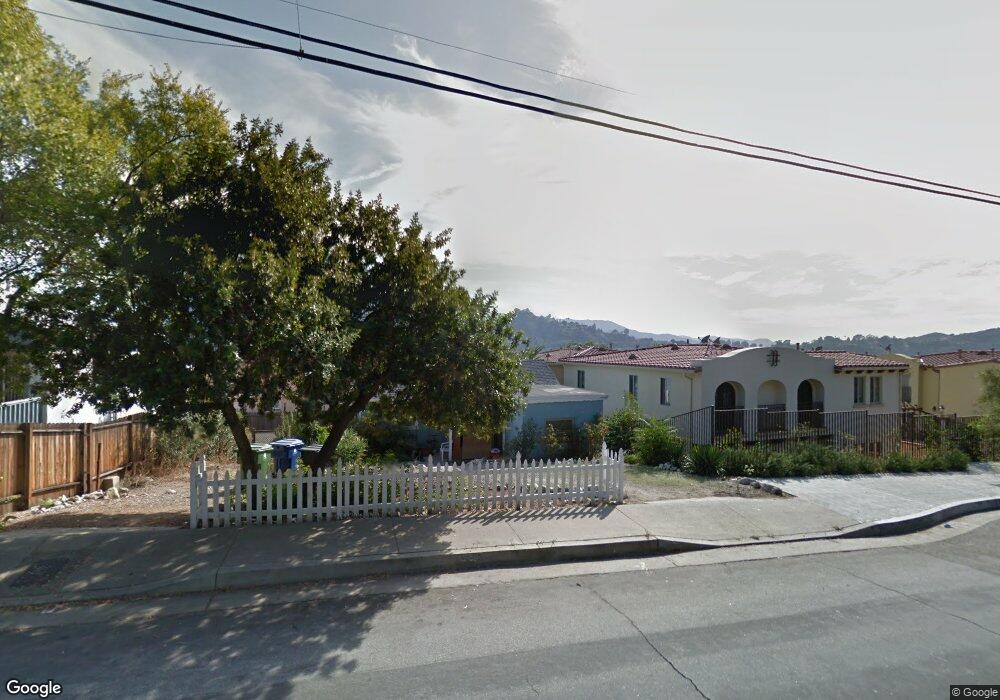
6912 Valmont St Tujunga, CA 91042
Estimated Value: $572,921 - $651,000
2
Beds
1
Bath
870
Sq Ft
$692/Sq Ft
Est. Value
About This Home
This home is located at 6912 Valmont St, Tujunga, CA 91042 and is currently estimated at $601,730, approximately $691 per square foot. 6912 Valmont St is a home located in Los Angeles County with nearby schools including Pinewood Avenue Elementary School, Mt. Gleason Middle School, and Verdugo Hills Senior High School.
Ownership History
Date
Name
Owned For
Owner Type
Purchase Details
Closed on
Jan 8, 2001
Sold by
Andrus Sue Ellen
Bought by
Porter Paul and Porter Myong
Current Estimated Value
Home Financials for this Owner
Home Financials are based on the most recent Mortgage that was taken out on this home.
Original Mortgage
$146,370
Interest Rate
7.06%
Mortgage Type
VA
Purchase Details
Closed on
Sep 28, 1998
Sold by
Shields William B
Bought by
Andrus Sue Ellen
Create a Home Valuation Report for This Property
The Home Valuation Report is an in-depth analysis detailing your home's value as well as a comparison with similar homes in the area
Home Values in the Area
Average Home Value in this Area
Purchase History
| Date | Buyer | Sale Price | Title Company |
|---|---|---|---|
| Porter Paul | $143,500 | Lawyers Title Company | |
| Andrus Sue Ellen | $20,000 | -- |
Source: Public Records
Mortgage History
| Date | Status | Borrower | Loan Amount |
|---|---|---|---|
| Previous Owner | Porter Paul | $146,370 |
Source: Public Records
Tax History
| Year | Tax Paid | Tax Assessment Tax Assessment Total Assessment is a certain percentage of the fair market value that is determined by local assessors to be the total taxable value of land and additions on the property. | Land | Improvement |
|---|---|---|---|---|
| 2025 | $2,329 | $193,600 | $20,480 | $173,120 |
| 2024 | $2,329 | $189,805 | $20,079 | $169,726 |
| 2023 | $2,284 | $186,085 | $19,686 | $166,399 |
| 2022 | $2,175 | $182,437 | $19,300 | $163,137 |
| 2021 | $2,144 | $178,861 | $18,922 | $159,939 |
| 2019 | $2,077 | $173,558 | $18,361 | $155,197 |
| 2018 | $2,049 | $170,155 | $18,001 | $152,154 |
| 2016 | $1,946 | $163,550 | $17,303 | $146,247 |
| 2015 | $1,917 | $161,095 | $17,044 | $144,051 |
| 2014 | $1,929 | $157,941 | $16,711 | $141,230 |
Source: Public Records
Map
Nearby Homes
- 6911 Valmont St
- 6920 Valmont St Unit 5
- 7006 Valmont St Unit B
- 10015 Marcus Ave
- 10018 Tujunga Canyon Blvd
- 10128 Haines Canyon Ave
- 7025 Day St
- 6834 Haywood St
- 10066 Golden Oaks Ave
- 0 Haines Canyon Ave
- 6854 Quinton Ln
- 6834 Quinton Ln
- 10214 Samoa Ave Unit 25
- 6812 Quinton Ln
- 7123 Greeley St Unit 102
- 9938 Commerce Ave
- 0 Tujunga Unit SR26033907
- 7115 Shadygrove St
- 6557 Tokay Rd
- 0 Foothill Blvd
- 10057 Marcus Ave
- 6906 Valmont St
- 10055 Marcus Ave
- 10049 Marcus Ave
- 6924 Valmont St
- 6924 Valmont St Unit 14
- 6924 Valmont St Unit 13
- 6924 Valmont St Unit 12
- 6924 Valmont St Unit 11
- 6924 Valmont St Unit 10
- 6924 Valmont St Unit 9
- 6924 Valmont St Unit 8
- 6860 Valmont St
- 6920 Valmont St Unit 7
- 6920 Valmont St Unit 6
- 6920 Valmont St Unit 4
- 6920 Valmont St Unit 3
- 6920 Valmont St Unit 2
- 6920 Valmont St Unit 1
- 6907 Valmont St
Your Personal Tour Guide
Ask me questions while you tour the home.