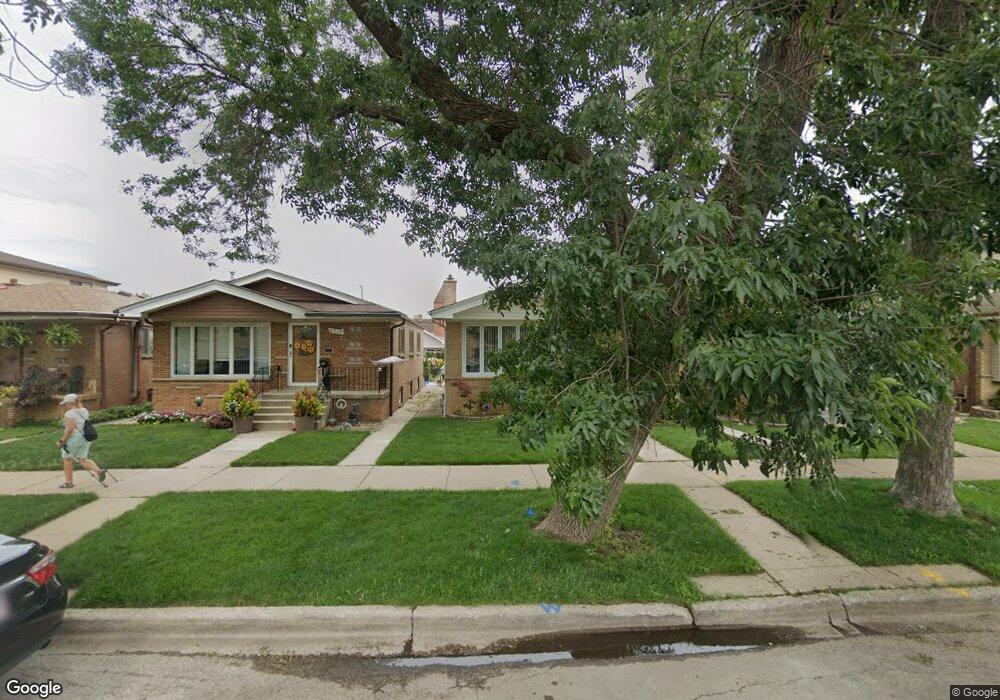
6912 W 64th Place Chicago, IL 60638
Clearing NeighborhoodEstimated Value: $269,000 - $332,000
3
Beds
1
Bath
984
Sq Ft
$318/Sq Ft
Est. Value
About This Home
This home is located at 6912 W 64th Place, Chicago, IL 60638 and is currently estimated at $312,964, approximately $318 per square foot. 6912 W 64th Place is a home located in Cook County with nearby schools including Dore Elementary School, Kennedy High School, and Peckwas Preparatory Academy.
Ownership History
Date
Name
Owned For
Owner Type
Purchase Details
Closed on
Aug 3, 2006
Sold by
Zieba Jan and Zieba Malgorzata
Bought by
Camarillo Ramon and Camarillo Irene
Current Estimated Value
Home Financials for this Owner
Home Financials are based on the most recent Mortgage that was taken out on this home.
Original Mortgage
$234,750
Outstanding Balance
$141,628
Interest Rate
6.85%
Mortgage Type
Unknown
Estimated Equity
$171,336
Purchase Details
Closed on
Nov 4, 2005
Sold by
Chicago Title Land Trust Co
Bought by
Zieba Jan and Zieba Malgorzata
Home Financials for this Owner
Home Financials are based on the most recent Mortgage that was taken out on this home.
Original Mortgage
$188,000
Interest Rate
5.75%
Mortgage Type
Fannie Mae Freddie Mac
Purchase Details
Closed on
Aug 18, 2003
Sold by
Domovich Joseph and Domovich Carmella
Bought by
Chicago Title Land Trust Co and Trust #1112229
Create a Home Valuation Report for This Property
The Home Valuation Report is an in-depth analysis detailing your home's value as well as a comparison with similar homes in the area
Home Values in the Area
Average Home Value in this Area
Purchase History
| Date | Buyer | Sale Price | Title Company |
|---|---|---|---|
| Camarillo Ramon | $313,000 | Alliance Title Company | |
| Zieba Jan | $235,000 | Pntn | |
| Chicago Title Land Trust Co | -- | Cti |
Source: Public Records
Mortgage History
| Date | Status | Borrower | Loan Amount |
|---|---|---|---|
| Open | Camarillo Ramon | $234,750 | |
| Previous Owner | Zieba Jan | $188,000 |
Source: Public Records
Tax History Compared to Growth
Tax History
| Year | Tax Paid | Tax Assessment Tax Assessment Total Assessment is a certain percentage of the fair market value that is determined by local assessors to be the total taxable value of land and additions on the property. | Land | Improvement |
|---|---|---|---|---|
| 2024 | $1,469 | $26,000 | $5,250 | $20,750 |
| 2023 | $1,477 | $23,001 | $4,688 | $18,313 |
| 2022 | $1,477 | $23,001 | $4,688 | $18,313 |
| 2021 | $1,398 | $22,999 | $4,687 | $18,312 |
| 2020 | $1,453 | $17,301 | $3,750 | $13,551 |
| 2019 | $1,448 | $19,224 | $3,750 | $15,474 |
| 2018 | $1,426 | $19,224 | $3,750 | $15,474 |
| 2017 | $1,527 | $16,037 | $3,375 | $12,662 |
| 2016 | $1,933 | $16,037 | $3,375 | $12,662 |
| 2015 | $1,859 | $16,037 | $3,375 | $12,662 |
| 2014 | $1,844 | $14,267 | $3,187 | $11,080 |
| 2013 | $1,998 | $15,403 | $3,187 | $12,216 |
Source: Public Records
Map
Nearby Homes
- 6927 W 64th Place Unit 2E
- 6850 W 64th St
- 6857 W 63rd Place
- 6419 S Oak Park Ave Unit E-25
- 6659 W 64th Place Unit 305
- 6637 W 64th Place
- 7216 W 63rd Place
- 7224 W 63rd Place
- 6206 S Nashville Ave
- 7241 W 62nd St
- 6104 S Nashville Ave
- 6031 S Normandy Ave
- 6430 W 64th Place
- 6416 W 64th Place Unit 3A
- 6020 S Nashville Ave
- 7409 W 63rd Place
- 5950 S Natoma Ave
- 7330 W 61st Place
- 7457 W 64th St
- 6322 W 63rd Place
- 6910 W 64th Place
- 6916 W 64th Place
- 6908 W 64th Place
- 6918 W 64th Place
- 6904 W 64th Place
- 6922 W 64th Place
- 6924 W 64th Place
- 6900 W 64th Place
- 6913 W 64th St
- 6917 W 64th St
- 6911 W 64th St
- 6928 W 64th Place
- 6907 W 64th St
- 6919 W 64th St
- 6905 W 64th St
- 6923 W 64th St
- 6930 W 64th Place
- 6927 W 64th St
- 6909 W 64th Place
- 6915 W 64th Place