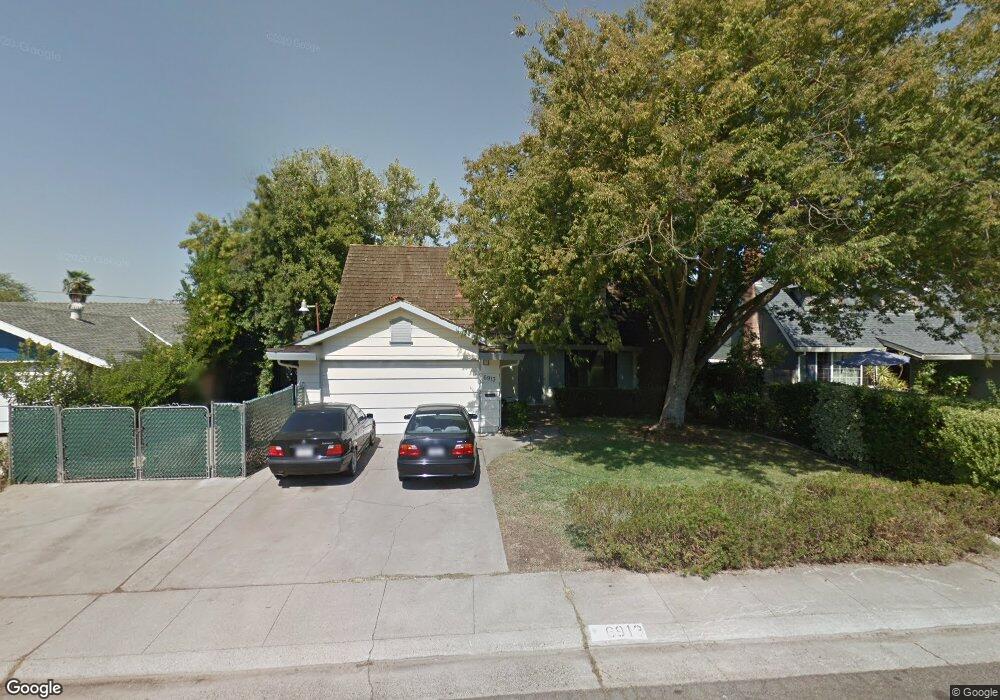
6913 Monte Casino Way Sacramento, CA 95828
Estimated Value: $334,000 - $482,000
4
Beds
2
Baths
1,628
Sq Ft
$264/Sq Ft
Est. Value
About This Home
This home is located at 6913 Monte Casino Way, Sacramento, CA 95828 and is currently estimated at $429,268, approximately $263 per square foot. 6913 Monte Casino Way is a home located in Sacramento County with nearby schools including David Reese Elementary School, James Rutter Middle School, and Florin High School.
Ownership History
Date
Name
Owned For
Owner Type
Purchase Details
Closed on
Jun 18, 2009
Sold by
Cunningham Thomas and Cunningham Diana L
Bought by
Mcmullen Larry
Current Estimated Value
Home Financials for this Owner
Home Financials are based on the most recent Mortgage that was taken out on this home.
Original Mortgage
$157,102
Outstanding Balance
$99,580
Interest Rate
4.83%
Mortgage Type
FHA
Estimated Equity
$329,688
Purchase Details
Closed on
May 4, 1998
Sold by
Ann Holsclaw William H and Ann M
Bought by
Cunningham Thomas and Cunningham Diana L
Home Financials for this Owner
Home Financials are based on the most recent Mortgage that was taken out on this home.
Original Mortgage
$104,500
Interest Rate
7.05%
Purchase Details
Closed on
Nov 22, 1996
Sold by
Va
Bought by
Holsclaw William H and Holsclaw Ann M
Create a Home Valuation Report for This Property
The Home Valuation Report is an in-depth analysis detailing your home's value as well as a comparison with similar homes in the area
Home Values in the Area
Average Home Value in this Area
Purchase History
| Date | Buyer | Sale Price | Title Company |
|---|---|---|---|
| Mcmullen Larry | $160,000 | Cornerstone Title Company | |
| Cunningham Thomas | $115,000 | First American Title Ins Co | |
| Holsclaw William H | -- | -- |
Source: Public Records
Mortgage History
| Date | Status | Borrower | Loan Amount |
|---|---|---|---|
| Open | Mcmullen Larry | $157,102 | |
| Previous Owner | Cunningham Thomas | $104,500 |
Source: Public Records
Tax History Compared to Growth
Tax History
| Year | Tax Paid | Tax Assessment Tax Assessment Total Assessment is a certain percentage of the fair market value that is determined by local assessors to be the total taxable value of land and additions on the property. | Land | Improvement |
|---|---|---|---|---|
| 2025 | $2,174 | $206,022 | $25,745 | $180,277 |
| 2024 | $2,174 | $201,984 | $25,241 | $176,743 |
| 2023 | $2,118 | $198,025 | $24,747 | $173,278 |
| 2022 | $2,081 | $194,143 | $24,262 | $169,881 |
| 2021 | $2,057 | $190,337 | $23,787 | $166,550 |
| 2020 | $2,029 | $188,387 | $23,544 | $164,843 |
| 2019 | $1,991 | $184,694 | $23,083 | $161,611 |
| 2018 | $1,921 | $181,074 | $22,631 | $158,443 |
| 2017 | $2,441 | $177,525 | $22,188 | $155,337 |
| 2016 | $1,817 | $174,045 | $21,753 | $152,292 |
| 2015 | $1,783 | $171,432 | $21,427 | $150,005 |
| 2014 | $1,752 | $168,075 | $21,008 | $147,067 |
Source: Public Records
Map
Nearby Homes
- 6944 Mirador Way
- 7548 Lindale Dr
- 7020 Sunnyslope Dr
- 6837 Southwood Way
- 7408 Lindale Dr
- 7312 Del Prado Way
- 7604 Loucreta Dr
- 6935 Arvada Ct
- 6990 Chris Ave
- 7631 Verna Mae Ave
- 6400 66th Ave Unit 21
- 6532 Harley Way
- 6916 Farmington Way
- 6912 Richeve Way
- 7442 Della Cir
- 6955 Lawnwood Dr
- 7413 Skander Way
- 7825 Rockhurst Way
- 7606 Tierra Arbor Way
- 6775 Briggs Dr
- 6917 Monte Casino Way
- 6909 Monte Casino Way
- 6920 Conrad Dr
- 7000 Conrad Dr
- 6910 Conrad Dr
- 6921 Monte Casino Way
- 6905 Monte Casino Way
- 6912 Monte Casino Way
- 6916 Monte Casino Way
- 7010 Conrad Dr
- 6900 Conrad Dr
- 6908 Monte Casino Way
- 6920 Monte Casino Way
- 6925 Monte Casino Way
- 7020 Conrad Dr
- 6901 Monte Casino Way
- 6904 Monte Casino Way
- 6932 Monte Casino Way
- 7201 Del Prado Way
- 6925 Barnum Ct