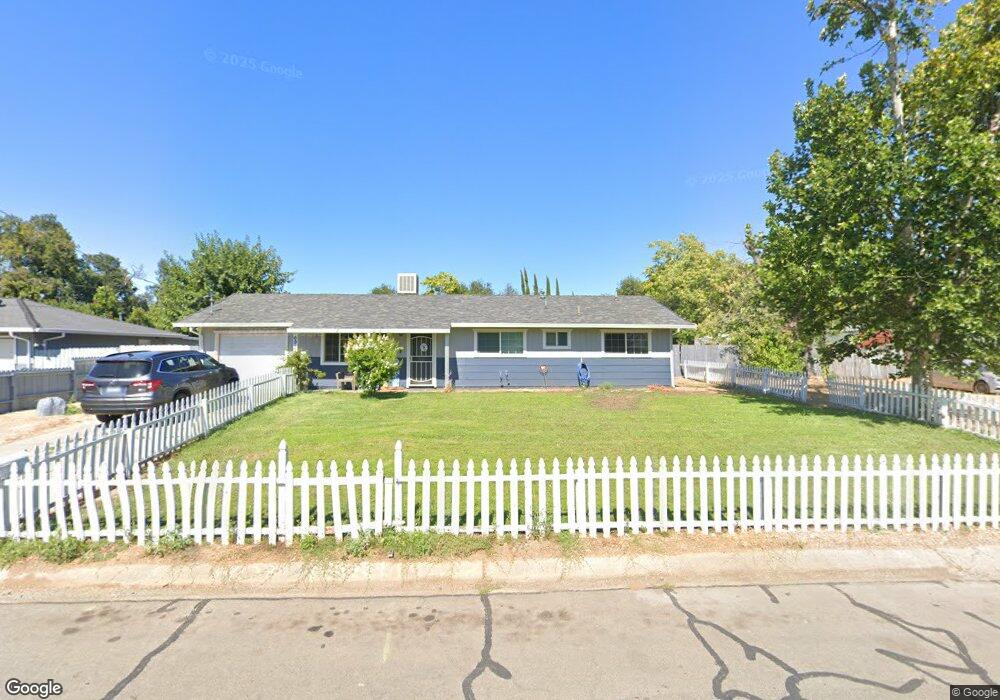
6913 Weeks Rd Redding, CA 96002
Estimated Value: $240,238 - $346,000
3
Beds
2
Baths
1,150
Sq Ft
$257/Sq Ft
Est. Value
About This Home
This home is located at 6913 Weeks Rd, Redding, CA 96002 and is currently estimated at $295,310, approximately $256 per square foot. 6913 Weeks Rd is a home located in Shasta County with nearby schools including Prairie Elementary School, Pacheco Elementary School, and Northern Summit Academy.
Ownership History
Date
Name
Owned For
Owner Type
Purchase Details
Closed on
Mar 21, 2011
Sold by
Poole Barbara B and Massey Patricia A
Bought by
Wilson Brian K and Wilson Mary L
Current Estimated Value
Purchase Details
Closed on
Apr 19, 2004
Sold by
Poole Barbara B
Bought by
Poole Barbara B and Massey Patricia A
Purchase Details
Closed on
Jan 28, 1999
Sold by
Va
Bought by
Poole Billy N and Poole Barbara B
Create a Home Valuation Report for This Property
The Home Valuation Report is an in-depth analysis detailing your home's value as well as a comparison with similar homes in the area
Purchase History
| Date | Buyer | Sale Price | Title Company |
|---|---|---|---|
| Wilson Brian K | $35,500 | None Available | |
| Poole Barbara B | -- | -- | |
| Poole Billy N | -- | -- |
Source: Public Records
Tax History
| Year | Tax Paid | Tax Assessment Tax Assessment Total Assessment is a certain percentage of the fair market value that is determined by local assessors to be the total taxable value of land and additions on the property. | Land | Improvement |
|---|---|---|---|---|
| 2025 | $517 | $45,469 | $32,023 | $13,446 |
| 2024 | $507 | $44,579 | $31,396 | $13,183 |
| 2023 | $507 | $43,706 | $30,781 | $12,925 |
| 2022 | $494 | $42,850 | $30,178 | $12,672 |
| 2021 | $485 | $42,011 | $29,587 | $12,424 |
| 2020 | $479 | $41,581 | $29,284 | $12,297 |
| 2019 | $473 | $40,766 | $28,710 | $12,056 |
| 2018 | $455 | $39,968 | $28,148 | $11,820 |
| 2017 | $461 | $39,186 | $27,597 | $11,589 |
| 2016 | $437 | $38,418 | $27,056 | $11,362 |
| 2015 | $436 | $37,842 | $26,650 | $11,192 |
| 2014 | $431 | $37,101 | $26,128 | $10,973 |
Source: Public Records
Map
Nearby Homes
- 6870 Riverland Dr
- 6950 Riverland Dr Unit 23
- 6950 Riverland Dr Unit 22
- 6950 Riverland Dr Unit 27
- 0 Milky Way
- 7100 Milky Way
- 7067 Tucker Ln
- 6927 Riata Dr
- 7408 Bridge Ln
- 19301 Clover Rd
- 6639 Riata Dr
- 7587 Fiesta Way
- 7155 The Terrace St
- 7520 Lockheed Dr
- 7530 Lockheed Dr
- 0 Villa Ct
- 7100 Amigo Way
- 6820 California 273
- 20260 River Valley Dr
- 7213 Amigo Way
Your Personal Tour Guide
Ask me questions while you tour the home.