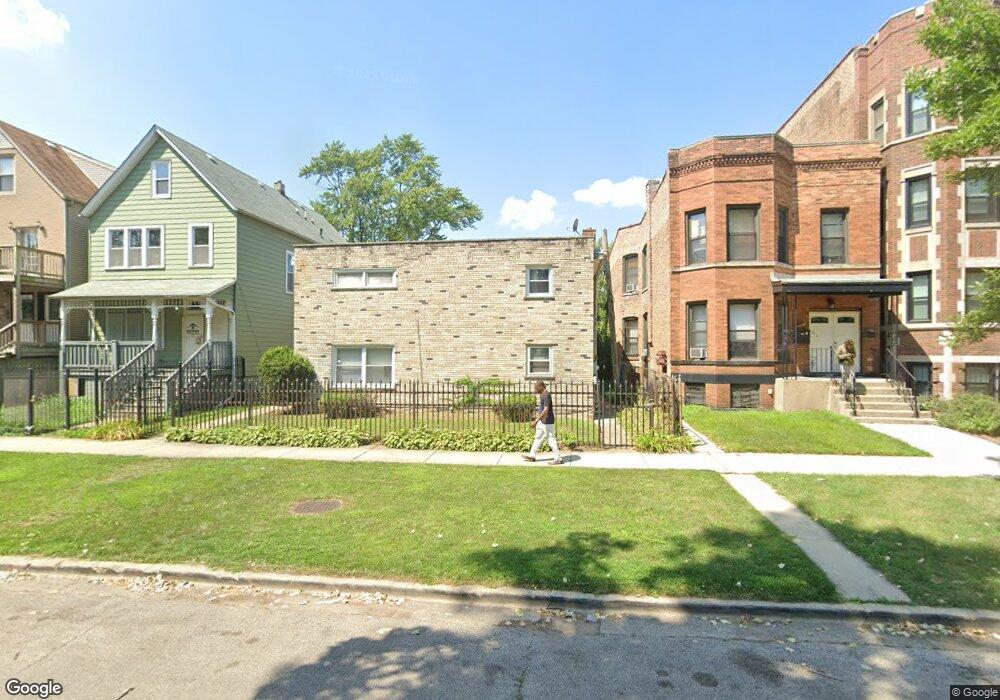
6914 S Cornell Ave Chicago, IL 60649
South Shore NeighborhoodEstimated Value: $116,000 - $216,000
2
Beds
2
Baths
1,006
Sq Ft
$155/Sq Ft
Est. Value
About This Home
This home is located at 6914 S Cornell Ave, Chicago, IL 60649 and is currently estimated at $155,443, approximately $154 per square foot. 6914 S Cornell Ave is a home located in Cook County with nearby schools including Parkside Elementary Community Academy, Hyde Park Academy High School, and Muhammad University.
Ownership History
Date
Name
Owned For
Owner Type
Purchase Details
Closed on
May 10, 2010
Sold by
Boyd Hr Inc
Bought by
Siller Dolores
Current Estimated Value
Home Financials for this Owner
Home Financials are based on the most recent Mortgage that was taken out on this home.
Original Mortgage
$78,837
Outstanding Balance
$52,463
Interest Rate
5.14%
Mortgage Type
FHA
Estimated Equity
$102,980
Purchase Details
Closed on
Apr 24, 2009
Sold by
Deutsche Bank National Trust Company
Bought by
Boyd Hr Inc
Purchase Details
Closed on
Jul 30, 2008
Sold by
Taiwo Shola
Bought by
Deutsche Bank National Trust Company
Purchase Details
Closed on
Jun 8, 2000
Sold by
Hud
Bought by
Taiwo Shola
Home Financials for this Owner
Home Financials are based on the most recent Mortgage that was taken out on this home.
Original Mortgage
$38,501
Interest Rate
12.45%
Mortgage Type
Purchase Money Mortgage
Create a Home Valuation Report for This Property
The Home Valuation Report is an in-depth analysis detailing your home's value as well as a comparison with similar homes in the area
Home Values in the Area
Average Home Value in this Area
Purchase History
| Date | Buyer | Sale Price | Title Company |
|---|---|---|---|
| Siller Dolores | $80,000 | Stewart Title Company | |
| Boyd Hr Inc | $31,000 | Premier Title Company | |
| Deutsche Bank National Trust Company | -- | None Available | |
| Taiwo Shola | -- | Stewart Title |
Source: Public Records
Mortgage History
| Date | Status | Borrower | Loan Amount |
|---|---|---|---|
| Open | Siller Dolores | $78,837 | |
| Previous Owner | Taiwo Shola | $38,501 |
Source: Public Records
Tax History
| Year | Tax Paid | Tax Assessment Tax Assessment Total Assessment is a certain percentage of the fair market value that is determined by local assessors to be the total taxable value of land and additions on the property. | Land | Improvement |
|---|---|---|---|---|
| 2025 | $953 | $9,601 | $1,313 | $8,288 |
| 2024 | $953 | $9,601 | $1,313 | $8,288 |
| 2023 | $925 | $4,501 | $1,313 | $3,188 |
| 2022 | $925 | $4,501 | $1,313 | $3,188 |
| 2021 | $905 | $4,499 | $1,312 | $3,187 |
| 2020 | $1,832 | $8,223 | $945 | $7,278 |
| 2019 | $1,836 | $9,137 | $945 | $8,192 |
| 2018 | $1,805 | $9,137 | $945 | $8,192 |
| 2017 | $1,671 | $7,761 | $840 | $6,921 |
| 2016 | $1,554 | $7,761 | $840 | $6,921 |
| 2015 | $1,422 | $7,761 | $840 | $6,921 |
| 2014 | $1,311 | $7,065 | $735 | $6,330 |
| 2013 | $1,285 | $7,065 | $735 | $6,330 |
Source: Public Records
Map
Nearby Homes
- 7821 S Stony Island Ave
- 7006 S East End Ave
- 7018 S Stony Island Ave
- 1715 E 70th St
- 7027 S Harper Ave
- 6823 S Ridgeland Ave
- 1464 E 69th St Unit 2N
- 7150-52 S Cornell Ave
- 1511 E 67th Place
- 1757 E 71st Place
- 1446 E 71st Place
- 6800 S Dante Ave Unit P13
- 6800 S Dante Ave Unit P14
- 6800 S Dante Ave Unit P15
- 1524 E 72nd St
- 6731 S Cregier Ave
- 1729 E 67th St Unit 2E
- 6945 S Dorchester Ave Unit 2S
- 6936 S Dorchester Ave
- 6938 S Dorchester Ave Unit 2
- 6914 S Cornell Ave Unit C
- 6914 S Cornell Ave
- 6914 S Cornell Ave
- 6914 S Cornell Ave
- 6914 S Cornell Ave
- 6914 S Cornell Ave
- 6914 S Cornell Ave
- 6914 S Cornell Ave Unit H
- 6914 S Cornell Ave Unit A
- 6912 S Cornell Ave
- 6912 S Cornell Ave
- 6918 S Cornell Ave
- 6916 S Cornell Ave
- 6916 S Cornell Ave
- 6916 S Cornell Ave
- 6916 S Cornell Ave
- 6916 S Cornell Ave
- 6916 S Cornell Ave
- 6916 S Cornell Ave
- 6916 S Cornell Ave
Your Personal Tour Guide
Ask me questions while you tour the home.