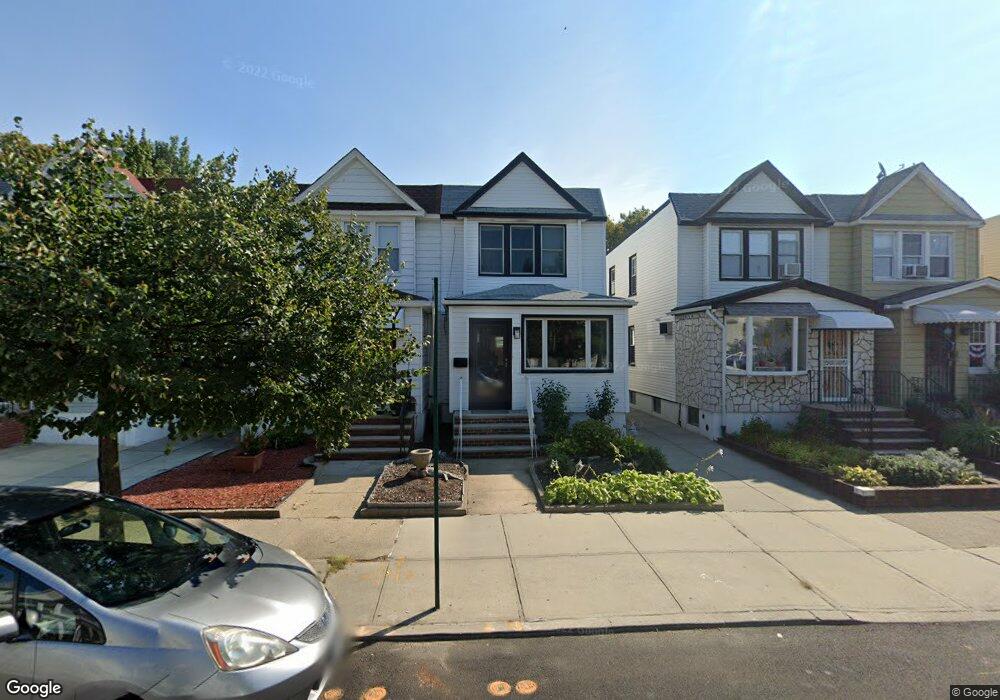
6917 66th St Glendale, NY 11385
Glendale NeighborhoodEstimated Value: $835,773 - $882,000
3
Beds
2
Baths
1,308
Sq Ft
$656/Sq Ft
Est. Value
About This Home
This home is located at 6917 66th St, Glendale, NY 11385 and is currently estimated at $857,693, approximately $655 per square foot. 6917 66th St is a home located in Queens County with nearby schools including P.S. 91 - Richard Arkwright, I.S. 119 the Glendale, and Success Academy Charter School-NYC 9.
Ownership History
Date
Name
Owned For
Owner Type
Purchase Details
Closed on
Dec 11, 2018
Sold by
6917 66Th St Group Corp
Bought by
Ossman Andrea and Ossman James
Current Estimated Value
Home Financials for this Owner
Home Financials are based on the most recent Mortgage that was taken out on this home.
Original Mortgage
$568,000
Outstanding Balance
$500,420
Interest Rate
4.8%
Mortgage Type
New Conventional
Estimated Equity
$357,273
Purchase Details
Closed on
Jun 2, 2017
Sold by
Strucuted Adjustable Rate Mortgage Loan and Us Bank National Association As Trustee
Bought by
6917 66Th St Group Corp
Purchase Details
Closed on
Apr 26, 2017
Sold by
Stephanie Goldstone Esq
Bought by
Structured Adjustable Rate Mortgage Loan and U S Bank National Association As Trust
Purchase Details
Closed on
Jan 13, 2004
Sold by
Johnson Dennis J and Johnson Karen
Bought by
Johnson Dennis J
Home Financials for this Owner
Home Financials are based on the most recent Mortgage that was taken out on this home.
Original Mortgage
$224,600
Interest Rate
5.82%
Mortgage Type
Purchase Money Mortgage
Create a Home Valuation Report for This Property
The Home Valuation Report is an in-depth analysis detailing your home's value as well as a comparison with similar homes in the area
Home Values in the Area
Average Home Value in this Area
Purchase History
| Date | Buyer | Sale Price | Title Company |
|---|---|---|---|
| Ossman Andrea | $710,000 | -- | |
| 6917 66Th St Group Corp | $462,000 | -- | |
| Structured Adjustable Rate Mortgage Loan | $723,897 | -- | |
| Johnson Dennis J | $50,000 | -- |
Source: Public Records
Mortgage History
| Date | Status | Borrower | Loan Amount |
|---|---|---|---|
| Open | Ossman Andrea | $568,000 | |
| Previous Owner | Johnson Dennis J | $224,600 |
Source: Public Records
Tax History Compared to Growth
Tax History
| Year | Tax Paid | Tax Assessment Tax Assessment Total Assessment is a certain percentage of the fair market value that is determined by local assessors to be the total taxable value of land and additions on the property. | Land | Improvement |
|---|---|---|---|---|
| 2025 | $6,865 | $36,116 | $9,061 | $27,055 |
| 2024 | $5,305 | $34,180 | $9,838 | $24,342 |
| 2023 | $6,477 | $32,246 | $9,134 | $23,112 |
| 2022 | $6,351 | $42,000 | $12,900 | $29,100 |
| 2021 | $6,334 | $42,420 | $12,900 | $29,520 |
| 2020 | $6,371 | $42,240 | $12,900 | $29,340 |
| 2019 | $5,958 | $39,120 | $12,900 | $26,220 |
| 2018 | $5,478 | $26,872 | $8,114 | $18,758 |
| 2017 | $5,404 | $26,512 | $10,106 | $16,406 |
| 2016 | $5,014 | $26,512 | $10,106 | $16,406 |
| 2015 | $2,797 | $25,081 | $13,321 | $11,760 |
| 2014 | $2,797 | $23,736 | $14,147 | $9,589 |
Source: Public Records
Map
Nearby Homes
- 6924 67th Place
- 70-30 65th Place
- 70-49 66th Place Unit 2 units
- 70-49 66th Place
- 67 67th Place
- 6924 68th Place
- 71-09 68th St
- 68-26 64th St
- 67-03 Myrtle Ave
- 71-51 67th Place
- 7402 65th St
- 70-27 69th St
- 74-40 65th St
- 69-37 Central Ave
- 70-36 70th St
- 74-33 65th St
- 73-30 72 St
- 7158 69th Place
- 65 Cooper Square Unit 3A
- 65 Cooper Square Unit 3B