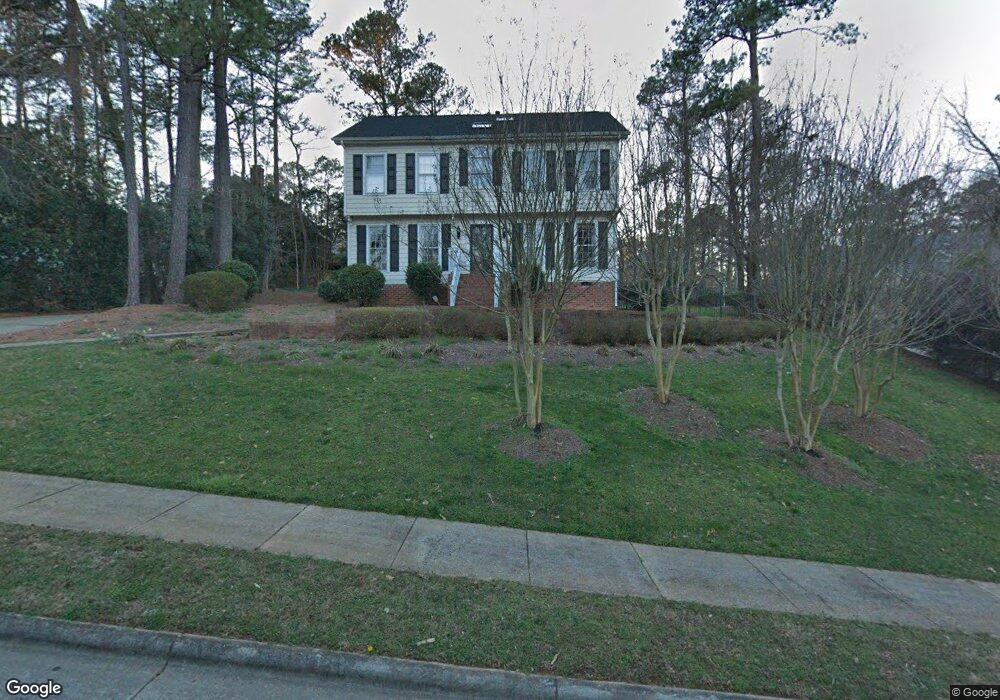
6917 Valley Ridge Ct Raleigh, NC 27615
Estimated Value: $802,000 - $996,000
4
Beds
3
Baths
3,400
Sq Ft
$259/Sq Ft
Est. Value
About This Home
This home is located at 6917 Valley Ridge Ct, Raleigh, NC 27615 and is currently estimated at $880,095, approximately $258 per square foot. 6917 Valley Ridge Ct is a home located in Wake County with nearby schools including North Ridge Elementary School, West Millbrook Middle School, and Millbrook High School.
Ownership History
Date
Name
Owned For
Owner Type
Purchase Details
Closed on
Mar 22, 2012
Sold by
Varnum Willard P
Bought by
Varnum Elizabeth A
Current Estimated Value
Home Financials for this Owner
Home Financials are based on the most recent Mortgage that was taken out on this home.
Original Mortgage
$356,000
Outstanding Balance
$244,780
Interest Rate
3.89%
Mortgage Type
New Conventional
Estimated Equity
$635,315
Purchase Details
Closed on
Mar 9, 1999
Sold by
Kanarek Benjamin
Bought by
Varnum Willard P and Varnum Elizabeth A
Home Financials for this Owner
Home Financials are based on the most recent Mortgage that was taken out on this home.
Original Mortgage
$228,000
Interest Rate
6.73%
Create a Home Valuation Report for This Property
The Home Valuation Report is an in-depth analysis detailing your home's value as well as a comparison with similar homes in the area
Home Values in the Area
Average Home Value in this Area
Purchase History
| Date | Buyer | Sale Price | Title Company |
|---|---|---|---|
| Varnum Elizabeth A | -- | None Available | |
| Varnum Willard P | $285,000 | -- |
Source: Public Records
Mortgage History
| Date | Status | Borrower | Loan Amount |
|---|---|---|---|
| Open | Varnum Elizabeth A | $356,000 | |
| Closed | Varnum Willard P | $228,000 |
Source: Public Records
Tax History Compared to Growth
Tax History
| Year | Tax Paid | Tax Assessment Tax Assessment Total Assessment is a certain percentage of the fair market value that is determined by local assessors to be the total taxable value of land and additions on the property. | Land | Improvement |
|---|---|---|---|---|
| 2025 | $7,354 | $840,950 | $430,000 | $410,950 |
| 2024 | $7,324 | $840,950 | $430,000 | $410,950 |
| 2023 | $5,435 | $496,743 | $150,000 | $346,743 |
| 2022 | $5,050 | $496,743 | $150,000 | $346,743 |
| 2021 | $4,853 | $496,743 | $150,000 | $346,743 |
| 2020 | $4,765 | $496,743 | $150,000 | $346,743 |
| 2019 | $5,279 | $453,824 | $180,000 | $273,824 |
| 2018 | $4,978 | $453,824 | $180,000 | $273,824 |
| 2017 | $4,741 | $453,824 | $180,000 | $273,824 |
| 2016 | $4,644 | $453,824 | $180,000 | $273,824 |
| 2015 | $4,694 | $451,423 | $180,000 | $271,423 |
| 2014 | $4,452 | $451,423 | $180,000 | $271,423 |
Source: Public Records
Map
Nearby Homes
- 6904 Aspen Ct
- 2301 Upper Oaks Way
- 7015 Litchford Rd
- 1925 Hunting Ridge Rd
- 7019 Litchford Rd
- 6311 Johnsdale Rd
- 6844 Greystone Dr
- 1820 Hunting Ridge Rd
- 7000 N Ridge Dr
- 7008 Racine Way
- 7140 N Ridge Dr
- 6309 Johnsdale Rd
- 1904 Merion Place
- 7316 Massachusetts Ct
- 2105 Prescott Place
- 2317 Declaration Dr
- 6805 Greystone Dr
- 2301 Declaration Dr
- 2328 Florida Ct
- 1416 Hedgelawn Way
- 6921 Valley Ridge Ct
- 2209 Royal Oaks Dr
- 2205 Royal Oaks Dr
- 6900 Brook Ridge Ct
- 6904 Brook Ridge Ct
- 6920 Valley Ridge Ct
- 6924 Valley Ridge Ct
- 6912 Valley Ridge Ct
- 2201 Royal Oaks Dr
- 6909 Valley Ridge Ct
- 2204 Royal Oaks Dr
- 6908 Brook Ridge Ct
- 6908 Valley Ridge Ct
- 2208 Weybridge Dr
- 2200 Royal Oaks Dr
- 2304 Weybridge Dr
- 6901 Brook Ridge Ct
- 2109 Royal Oaks Dr
- 2221 Weybridge Dr
- 2204 Weybridge Dr