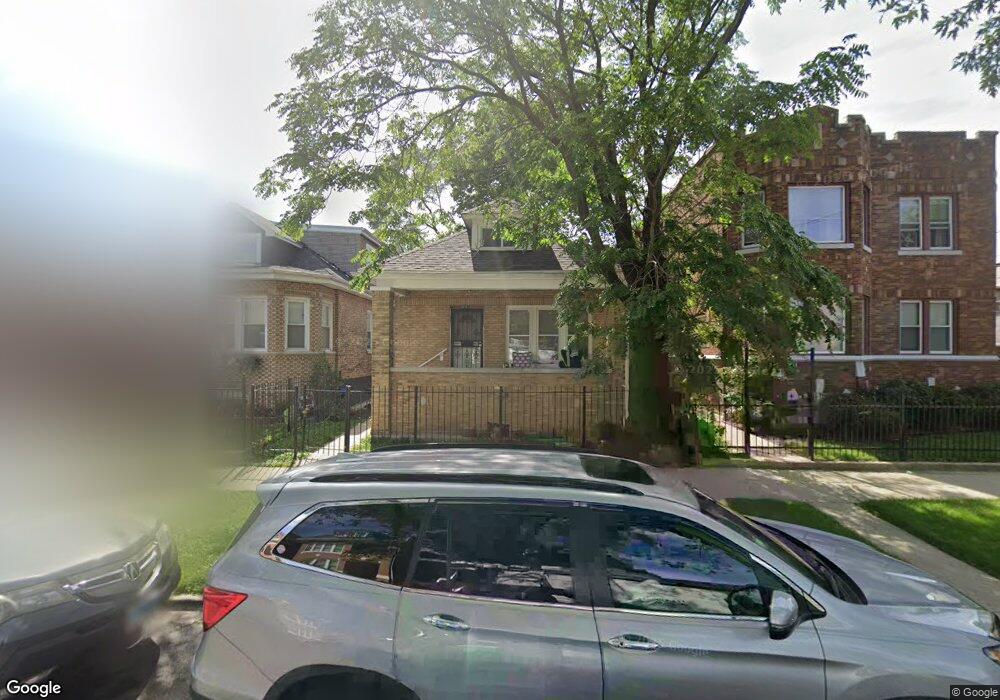
6918 S Campbell Ave Chicago, IL 60629
Marquette Park NeighborhoodEstimated Value: $116,000 - $228,161
3
Beds
2
Baths
861
Sq Ft
$213/Sq Ft
Est. Value
About This Home
This home is located at 6918 S Campbell Ave, Chicago, IL 60629 and is currently estimated at $183,540, approximately $213 per square foot. 6918 S Campbell Ave is a home located in Cook County with nearby schools including McKay Elementary School, Gage Park High School, and The Montessori School of Englewood Charter School.
Ownership History
Date
Name
Owned For
Owner Type
Purchase Details
Closed on
Jun 24, 2010
Sold by
Us Bank National Association
Bought by
Jackson Brian J
Current Estimated Value
Purchase Details
Closed on
May 5, 2010
Sold by
Stanford Joseph
Bought by
Us Bank National Association
Purchase Details
Closed on
Sep 30, 2005
Sold by
Burrell Allyson J
Bought by
Stanford Joseph
Home Financials for this Owner
Home Financials are based on the most recent Mortgage that was taken out on this home.
Original Mortgage
$108,000
Interest Rate
7.55%
Mortgage Type
Unknown
Purchase Details
Closed on
Jun 22, 2000
Sold by
Traylor Allyson J and Burrell Allyson J
Bought by
Burrell Allyson J
Home Financials for this Owner
Home Financials are based on the most recent Mortgage that was taken out on this home.
Original Mortgage
$62,400
Interest Rate
8.55%
Create a Home Valuation Report for This Property
The Home Valuation Report is an in-depth analysis detailing your home's value as well as a comparison with similar homes in the area
Home Values in the Area
Average Home Value in this Area
Purchase History
| Date | Buyer | Sale Price | Title Company |
|---|---|---|---|
| Jackson Brian J | $25,000 | Ticor Title Insurance Co | |
| Us Bank National Association | -- | None Available | |
| Stanford Joseph | $135,000 | First American Title Ins Co | |
| Burrell Allyson J | -- | -- |
Source: Public Records
Mortgage History
| Date | Status | Borrower | Loan Amount |
|---|---|---|---|
| Previous Owner | Stanford Joseph | $108,000 | |
| Previous Owner | Burrell Allyson J | $62,400 |
Source: Public Records
Tax History Compared to Growth
Tax History
| Year | Tax Paid | Tax Assessment Tax Assessment Total Assessment is a certain percentage of the fair market value that is determined by local assessors to be the total taxable value of land and additions on the property. | Land | Improvement |
|---|---|---|---|---|
| 2024 | $2,333 | $15,000 | $1,890 | $13,110 |
| 2023 | $2,275 | $11,000 | $3,024 | $7,976 |
| 2022 | $2,275 | $11,000 | $3,024 | $7,976 |
| 2021 | $2,212 | $11,000 | $3,024 | $7,976 |
| 2020 | $1,960 | $8,743 | $3,024 | $5,719 |
| 2019 | $1,964 | $9,715 | $3,024 | $6,691 |
| 2018 | $1,931 | $9,715 | $3,024 | $6,691 |
| 2017 | $2,560 | $11,187 | $2,646 | $8,541 |
| 2016 | $2,377 | $11,187 | $2,646 | $8,541 |
| 2015 | $2,181 | $11,187 | $2,646 | $8,541 |
| 2014 | $1,863 | $9,416 | $2,457 | $6,959 |
| 2013 | $1,829 | $9,416 | $2,457 | $6,959 |
Source: Public Records
Map
Nearby Homes
- 6922 S Campbell Ave
- 6935 S Campbell Ave
- 6821 S Campbell Ave
- 6808 S Maplewood Ave
- 7022 S Maplewood Ave
- 7034 S Artesian Ave
- 6741 S Maplewood Ave
- 6822 S Claremont Ave
- 6806 S Rockwell St
- 6734 S Maplewood Ave
- 6739 S Rockwell St
- 2641 W 69th St
- 7048 S Western Ave
- 6933 S Washtenaw Ave
- 7115 S Rockwell St
- 6942 S Bell Ave
- 7019 S Oakley Ave
- 6715 S Claremont Ave
- 6943 S Bell Ave
- 6749 S Oakley Ave
- 6914 S Campbell Ave
- 6924 S Campbell Ave
- 6928 S Campbell Ave
- 6930 S Campbell Ave
- 6900 S Campbell Ave
- 6919 S Maplewood Ave
- 6923 S Maplewood Ave
- 6917 S Maplewood Ave
- 2507 W 69th St
- 6925 S Maplewood Ave
- 6934 S Campbell Ave
- 2505 W 69th St
- 2511 W 69th St
- 2511 W Lithuanian Plaza Ct
- 2515 W 69th St
- 2517 W 69th St
- 2517 W 69th St
- 6923 S Campbell Ave Unit 2
- 6938 S Campbell Ave
- 6938 S Campbell Ave