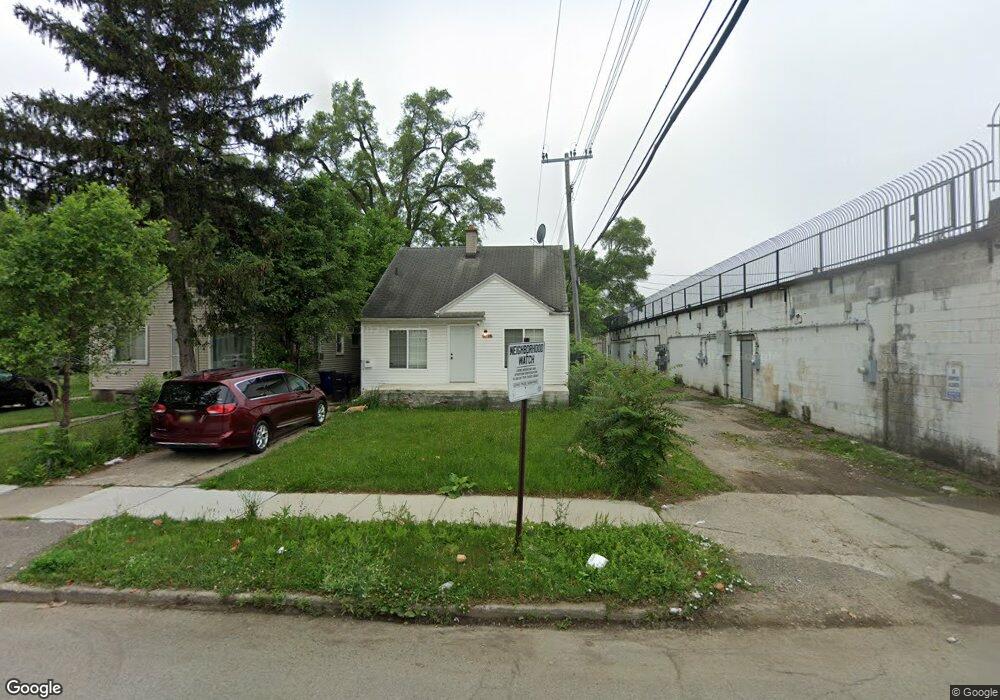
6919 Mansfield St Detroit, MI 48228
Warren Avenue Community NeighborhoodEstimated Value: $83,675 - $129,000
3
Beds
2
Baths
1,224
Sq Ft
$85/Sq Ft
Est. Value
About This Home
This home is located at 6919 Mansfield St, Detroit, MI 48228 and is currently estimated at $104,169, approximately $85 per square foot. 6919 Mansfield St is a home located in Wayne County with nearby schools including Gardner Elementary School, Charles L. Spain Elementary-Middle School, and Edward 'Duke' Ellington Conservatory of Music and Art.
Ownership History
Date
Name
Owned For
Owner Type
Purchase Details
Closed on
Jul 24, 2020
Sold by
Al Shara Yahia
Bought by
Essa Omar A Ali
Current Estimated Value
Purchase Details
Closed on
Jul 26, 2019
Sold by
Alfatlawi Widsad and Alfatlawi Wendy
Bought by
Al Shara Yahia
Purchase Details
Closed on
Feb 18, 2015
Sold by
Al Yasiry Zahra
Bought by
Al Fatlawi Widad
Purchase Details
Closed on
Sep 11, 2014
Sold by
Fatlawi Widad Huwadi Al
Bought by
Al Yasiry Zahra F
Purchase Details
Closed on
Jul 8, 2014
Sold by
Naseer Ali
Bought by
Al Fatlawi Widad Huwadi
Purchase Details
Closed on
Aug 25, 2010
Sold by
Donovan Shaun
Bought by
Naseer Ali
Purchase Details
Closed on
Dec 14, 2009
Sold by
Wells Fargo Bank Na
Bought by
The Secretary Of Housing & Urban Develop
Purchase Details
Closed on
Jun 10, 2009
Sold by
Alsaady Ahmed
Bought by
Wells Fargo Bank Na
Create a Home Valuation Report for This Property
The Home Valuation Report is an in-depth analysis detailing your home's value as well as a comparison with similar homes in the area
Home Values in the Area
Average Home Value in this Area
Purchase History
| Date | Buyer | Sale Price | Title Company |
|---|---|---|---|
| Essa Omar A Ali | $30,500 | None Available | |
| Al Shara Yahia | $2,000 | None Available | |
| Al Fatlawi Widad | -- | None Available | |
| Al Yasiry Zahra F | -- | None Available | |
| Al Fatlawi Widad Huwadi | -- | None Available | |
| Naseer Ali | $3,170 | None Available | |
| The Secretary Of Housing & Urban Develop | -- | None Available | |
| Wells Fargo Bank Na | $78,097 | None Available |
Source: Public Records
Tax History Compared to Growth
Tax History
| Year | Tax Paid | Tax Assessment Tax Assessment Total Assessment is a certain percentage of the fair market value that is determined by local assessors to be the total taxable value of land and additions on the property. | Land | Improvement |
|---|---|---|---|---|
| 2025 | $1,537 | $32,400 | $0 | $0 |
| 2024 | $1,537 | $26,800 | $0 | $0 |
| 2023 | $1,492 | $21,300 | $0 | $0 |
| 2022 | $1,594 | $18,900 | $0 | $0 |
| 2021 | $908 | $15,000 | $0 | $0 |
| 2020 | $899 | $13,300 | $0 | $0 |
| 2019 | $887 | $10,800 | $0 | $0 |
| 2018 | $120 | $9,700 | $0 | $0 |
| 2017 | $769 | $8,800 | $0 | $0 |
| 2016 | $1,040 | $15,900 | $0 | $0 |
| 2015 | $1,590 | $15,900 | $0 | $0 |
| 2013 | $2,233 | $22,334 | $0 | $0 |
| 2010 | -- | $32,000 | $541 | $31,459 |
Source: Public Records
Map
Nearby Homes
- 7337 Saint Marys St
- 7415 Mettetal St
- 6578 Montrose St
- 7420 Memorial Ave
- 6320 Saint Marys St
- 7309 Memorial Ave
- 7776 Mettetal St
- 7317 Memorial Ave
- 7768 Asbury Park
- 7318 Clayburn St
- 6934 Coleman St
- 6848 Rutland St
- 7019 Barrie St
- 6345 Woodmont Ave
- 6344 Grandmont Ave
- 7410 Barrie St
- 7484 Clayburn St
- 6801 Rutland St
- 7115 Payne Ave
- 7519 Barrie St
- 6919 Mansfield St Unit Bldg-Unit
- 6913 Mansfield St
- 6907 Mansfield St
- 16103 W Warren Ave
- 6901 Mansfield St
- 16107 W Warren Ave
- 6893 Mansfield St
- 16135 W Warren Ave
- 16139 W Warren Ave
- 6920 Saint Marys St
- 6914 Saint Marys St
- 16047 W Warren Ave
- 6906 Saint Marys St
- 16041 W Warren Ave
- 6900 Saint Marys St
- 6920 Mansfield St
- 16111 W West Warren Ave
- 6912 Mansfield St
- 16115 W Warren Ave
- 16123 W Warren Ave