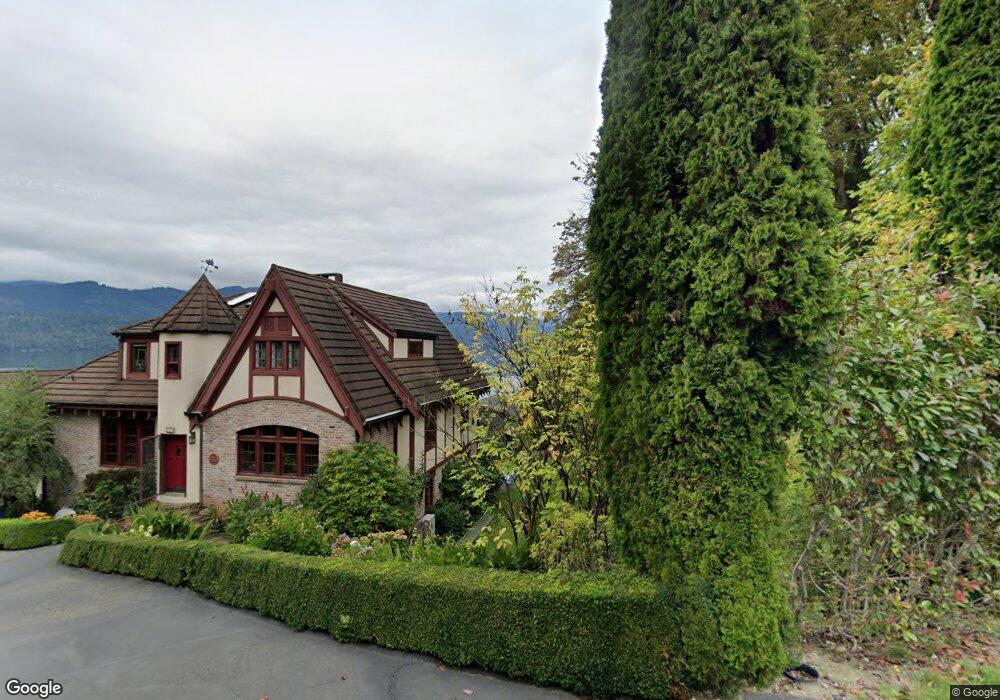
692 W Wyatt Ln Seabeck, WA 98380
Estimated Value: $467,000 - $541,000
2
Beds
1
Bath
1,008
Sq Ft
$489/Sq Ft
Est. Value
About This Home
This home is located at 692 W Wyatt Ln, Seabeck, WA 98380 and is currently estimated at $493,322, approximately $489 per square foot. 692 W Wyatt Ln is a home located in Kitsap County with nearby schools including Green Mountain Elementary School and Klahowya Secondary School.
Create a Home Valuation Report for This Property
The Home Valuation Report is an in-depth analysis detailing your home's value as well as a comparison with similar homes in the area
Home Values in the Area
Average Home Value in this Area
Tax History Compared to Growth
Tax History
| Year | Tax Paid | Tax Assessment Tax Assessment Total Assessment is a certain percentage of the fair market value that is determined by local assessors to be the total taxable value of land and additions on the property. | Land | Improvement |
|---|---|---|---|---|
| 2026 | $3,972 | $417,130 | $154,790 | $262,340 |
| 2025 | $3,972 | $417,130 | $154,790 | $262,340 |
| 2024 | $3,863 | $417,130 | $154,790 | $262,340 |
| 2023 | $3,654 | $392,250 | $182,530 | $209,720 |
| 2022 | $3,483 | $329,200 | $146,230 | $182,970 |
| 2021 | $3,089 | $276,890 | $116,980 | $159,910 |
| 2020 | $2,908 | $263,460 | $110,930 | $152,530 |
| 2019 | $2,814 | $246,860 | $110,930 | $135,930 |
| 2018 | $3,015 | $181,630 | $67,830 | $113,800 |
| 2017 | $2,382 | $181,630 | $67,830 | $113,800 |
| 2016 | $2,177 | $153,130 | $58,980 | $94,150 |
| 2015 | $2,087 | $153,130 | $58,980 | $94,150 |
| 2014 | -- | $149,860 | $58,980 | $90,880 |
| 2013 | -- | $149,860 | $58,980 | $90,880 |
Source: Public Records
Map
Nearby Homes
- 22779 NW Seabeck Holly Rd
- 280 N Will Webb Rd
- 340 N Seagull Way
- 50 N Rustic Ridge Dr
- 310 N Beacon Point Loop S
- 80 N Beacon Point Loop S
- 560 N Beacon Point Loop N
- 20 N Triton Head Dr
- 680 N Triton Heights Rd
- 0 XXX N Triton Heights Rd
- 126 Handley Ln
- 0 NE Tahuya Blacksmith Unit NWM2389298
- 0 Maple Ave
- 11 Williams Ct
- 670 Mallard Ln NW
- 111 N Jorstad Creek Rd
- 91 N Hood View Place
- 221 N Trail Head Loop
- 31 Hood Place
- 172 Cirque Dr
- 668 Wyatt Ln W
- 667 Wyatt Ln W
- 745 Seabeck Holly Rd W
- 588 Allan King Rd W
- 640 Seabeck Holly Rd NW
- 705 W Wyatt Ln
- 608 Allan King Rd W
- 672 Allan King Rd W
- 1 .27AC Allan King Rd W
- 550 Allan King Rd W
- 2 .3 acres Seabeck Holly Rd W
- 832 Wyatt Ln W
- 572 Allan King Rd W
- 678 Allan King Rd W
- 750 Allan King Rd W
- 640 Seabeck Holly Rd W
- 0 Albert Pfundt Rd NW
- 532 Allan King Rd W
- 764 Seabeck Holly Rd W
- 700 Seabeck Holly Rd W