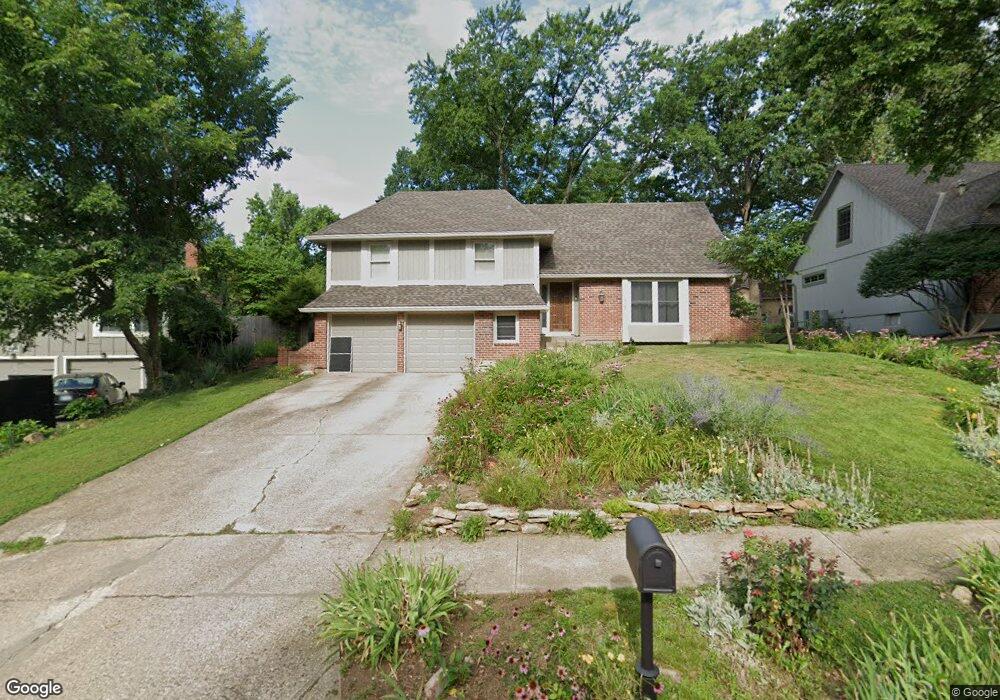
6920 Long Ave Shawnee, KS 66216
Estimated Value: $380,000 - $420,000
4
Beds
3
Baths
1,570
Sq Ft
$252/Sq Ft
Est. Value
About This Home
This home is located at 6920 Long Ave, Shawnee, KS 66216 and is currently estimated at $395,399, approximately $251 per square foot. 6920 Long Ave is a home located in Johnson County with nearby schools including Rhein Benninghoven Elementary School, Trailridge Middle School, and Shawnee Mission Northwest High School.
Ownership History
Date
Name
Owned For
Owner Type
Purchase Details
Closed on
Apr 20, 2016
Sold by
Hegeman Lesia Boone
Bought by
Hegeman Lesia B
Current Estimated Value
Purchase Details
Closed on
Mar 23, 2004
Sold by
Boone Hegeman Lesia
Bought by
Boone Hegeman Lesia and Lesia Boone Hegeman Declaration Of Trust
Home Financials for this Owner
Home Financials are based on the most recent Mortgage that was taken out on this home.
Original Mortgage
$145,073
Interest Rate
5.59%
Mortgage Type
FHA
Purchase Details
Closed on
Oct 25, 2001
Sold by
Hegeman Lesia Boone
Bought by
Hegeman Lesia Boone
Purchase Details
Closed on
Feb 22, 2001
Sold by
Trotter Timothy J and Trotter Janice E
Bought by
Hegeman Lesia Boone and Hegeman Leisa B
Home Financials for this Owner
Home Financials are based on the most recent Mortgage that was taken out on this home.
Original Mortgage
$149,814
Interest Rate
6.97%
Mortgage Type
FHA
Create a Home Valuation Report for This Property
The Home Valuation Report is an in-depth analysis detailing your home's value as well as a comparison with similar homes in the area
Home Values in the Area
Average Home Value in this Area
Purchase History
| Date | Buyer | Sale Price | Title Company |
|---|---|---|---|
| Hegeman Lesia B | -- | None Available | |
| Boone Hegeman Lesia | -- | Columbian Title | |
| Boone Hegeman Lesia | -- | Columbia Title | |
| Hegeman Lesia Boone | -- | -- | |
| Hegeman Lesia Boone | -- | Security Land Title Company |
Source: Public Records
Mortgage History
| Date | Status | Borrower | Loan Amount |
|---|---|---|---|
| Previous Owner | Boone Hegeman Lesia | $145,073 | |
| Previous Owner | Hegeman Lesia Boone | $149,814 |
Source: Public Records
Tax History Compared to Growth
Tax History
| Year | Tax Paid | Tax Assessment Tax Assessment Total Assessment is a certain percentage of the fair market value that is determined by local assessors to be the total taxable value of land and additions on the property. | Land | Improvement |
|---|---|---|---|---|
| 2024 | $4,386 | $41,412 | $7,911 | $33,501 |
| 2023 | $4,242 | $39,560 | $7,911 | $31,649 |
| 2022 | $3,662 | $34,040 | $6,875 | $27,165 |
| 2021 | $3,662 | $31,521 | $6,249 | $25,272 |
| 2020 | $3,452 | $29,705 | $5,678 | $24,027 |
| 2019 | $3,141 | $26,991 | $5,164 | $21,827 |
| 2018 | $3,152 | $26,991 | $5,164 | $21,827 |
| 2017 | $2,864 | $24,127 | $4,487 | $19,640 |
| 2016 | $2,756 | $22,919 | $4,487 | $18,432 |
| 2015 | $2,465 | $21,309 | $4,487 | $16,822 |
| 2013 | -- | $22,149 | $4,487 | $17,662 |
Source: Public Records
Map
Nearby Homes
- Augusta Plan at Kenneth Estates
- Newport Plan at Kenneth Estates
- Rosemount II Plan at Kenneth Estates
- The Avala Villa Plan at Kenneth Estates
- The Rosemount Villa Plan at Kenneth Estates
- Catalina II Plan at Kenneth Estates
- The Avala Plan at Kenneth Estates
- 12811 W 71st St
- 7130 Westgate St
- 7105 Richards Dr
- 7115 Richards Dr
- 13100 W 72nd St
- 12403 W 72nd Terrace
- 12300 W 67th Terrace
- 12914 W 67th St
- 6564 Charles St
- 6610 Halsey St
- 6556 Charles St
- 7107 Garnett St
- 11637 W 68th Terrace
- 6914 Long Ave
- 6924 Long Ave
- 12506 W 70th St
- 6910 Long Ave
- 6919 Westgate St
- 6921 Long Ave
- 6915 Long Ave
- 6925 Long Ave
- 6915 Long Ave
- 6923 Westgate St
- 6915 Westgate St
- 6929 Long Ave
- 12505 W 70th St
- 7002 Long Ave
- 12507 W 70th St
- 12511 W 70th St
- 6905 Long Ave
- 12411 W 70th St
- 7003 Long Ave
- 6911 Westgate St