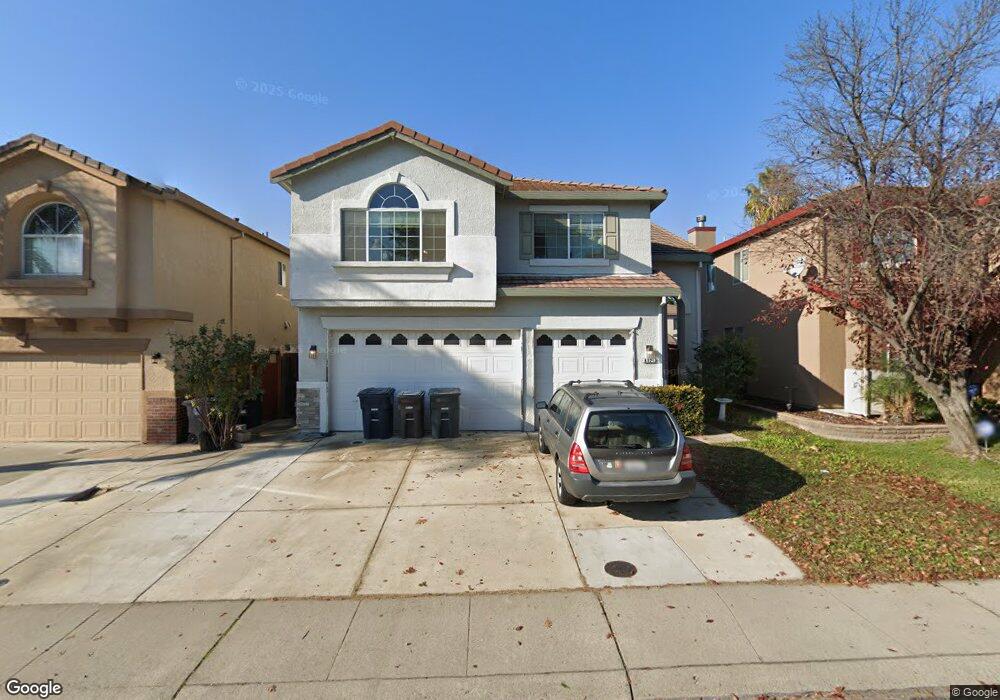
6921 Saddle Horse Way Citrus Heights, CA 95621
Estimated Value: $503,000 - $618,000
4
Beds
3
Baths
2,520
Sq Ft
$229/Sq Ft
Est. Value
About This Home
This home is located at 6921 Saddle Horse Way, Citrus Heights, CA 95621 and is currently estimated at $577,771, approximately $229 per square foot. 6921 Saddle Horse Way is a home located in Sacramento County with nearby schools including Arlington Heights Elementary School, Sylvan Middle School, and Mesa Verde High School.
Ownership History
Date
Name
Owned For
Owner Type
Purchase Details
Closed on
Sep 10, 2002
Sold by
Rinker Dean Samuel and Rinker Margie Lynn
Bought by
Dudley David and Dudley Vicky
Current Estimated Value
Home Financials for this Owner
Home Financials are based on the most recent Mortgage that was taken out on this home.
Original Mortgage
$200,000
Outstanding Balance
$84,339
Interest Rate
6.37%
Estimated Equity
$493,432
Purchase Details
Closed on
May 25, 2000
Sold by
Kaufman & Broad Of Sacramento Inc
Bought by
Rinker Dean Samuel and Rinker Margie Lynn
Home Financials for this Owner
Home Financials are based on the most recent Mortgage that was taken out on this home.
Original Mortgage
$170,000
Interest Rate
8.18%
Create a Home Valuation Report for This Property
The Home Valuation Report is an in-depth analysis detailing your home's value as well as a comparison with similar homes in the area
Home Values in the Area
Average Home Value in this Area
Purchase History
| Date | Buyer | Sale Price | Title Company |
|---|---|---|---|
| Dudley David | $290,000 | Financial Title Company | |
| Rinker Dean Samuel | $213,000 | First American Title Ins Co |
Source: Public Records
Mortgage History
| Date | Status | Borrower | Loan Amount |
|---|---|---|---|
| Open | Dudley David | $200,000 | |
| Previous Owner | Rinker Dean Samuel | $170,000 |
Source: Public Records
Tax History Compared to Growth
Tax History
| Year | Tax Paid | Tax Assessment Tax Assessment Total Assessment is a certain percentage of the fair market value that is determined by local assessors to be the total taxable value of land and additions on the property. | Land | Improvement |
|---|---|---|---|---|
| 2025 | $4,991 | $419,853 | $65,165 | $354,688 |
| 2024 | $4,991 | $411,622 | $63,888 | $347,734 |
| 2023 | $4,863 | $403,552 | $62,636 | $340,916 |
| 2022 | $4,833 | $395,640 | $61,408 | $334,232 |
| 2021 | $4,750 | $387,883 | $60,204 | $327,679 |
| 2020 | $4,663 | $383,907 | $59,587 | $324,320 |
| 2019 | $4,570 | $376,380 | $58,419 | $317,961 |
| 2018 | $4,517 | $369,001 | $57,274 | $311,727 |
| 2017 | $4,472 | $361,766 | $56,151 | $305,615 |
| 2016 | $4,183 | $354,673 | $55,050 | $299,623 |
| 2015 | $4,112 | $349,347 | $54,224 | $295,123 |
| 2014 | $4,027 | $342,504 | $53,162 | $289,342 |
Source: Public Records
Map
Nearby Homes
- 6912 van Maren Ln
- 6608 Trailride Way
- 7101 van Maren Ln
- 6829 Kittery Ave
- 6937 Grand Tree Ln
- 6862 Westchester Way
- 7105 Ansley Ct
- 6917 Vera Cruz Ct
- 6327 Westbrook Dr
- 6336 Twin Wood Way
- 6709 Alden Ln
- 6717 Alden Ln
- 7032 Sunburst Way
- 6936 Winlock Ave
- 6543 Crosswoods Cir
- 6821 Susanna Ct
- 6923 Daisy Ln
- 6752 Bertran Ct
- 6914 San Angelo Ct
- 6838 Susanna Ct
- 6917 Saddle Horse Way
- 6925 Saddle Horse Way
- 6913 Saddle Horse Way
- 6929 Saddle Horse Way
- 6920 Ranch House Way
- 6916 Ranch House Way
- 6924 Ranch House Way
- 6912 Ranch House Way
- 6928 Ranch House Way
- 6933 Saddle Horse Way
- 6909 Saddle Horse Way
- 6920 Saddle Horse Way
- 6924 Saddle Horse Way
- 6912 Saddle Horse Way
- 6908 Ranch House Way
- 6932 Ranch House Way
- 6928 Saddle Horse Way
- 6905 Saddle Horse Way
- 6937 Saddle Horse Way
- 6908 Saddle Horse Way