Estimated Value: $466,000 - $516,000
3
Beds
2
Baths
2,029
Sq Ft
$240/Sq Ft
Est. Value
About This Home
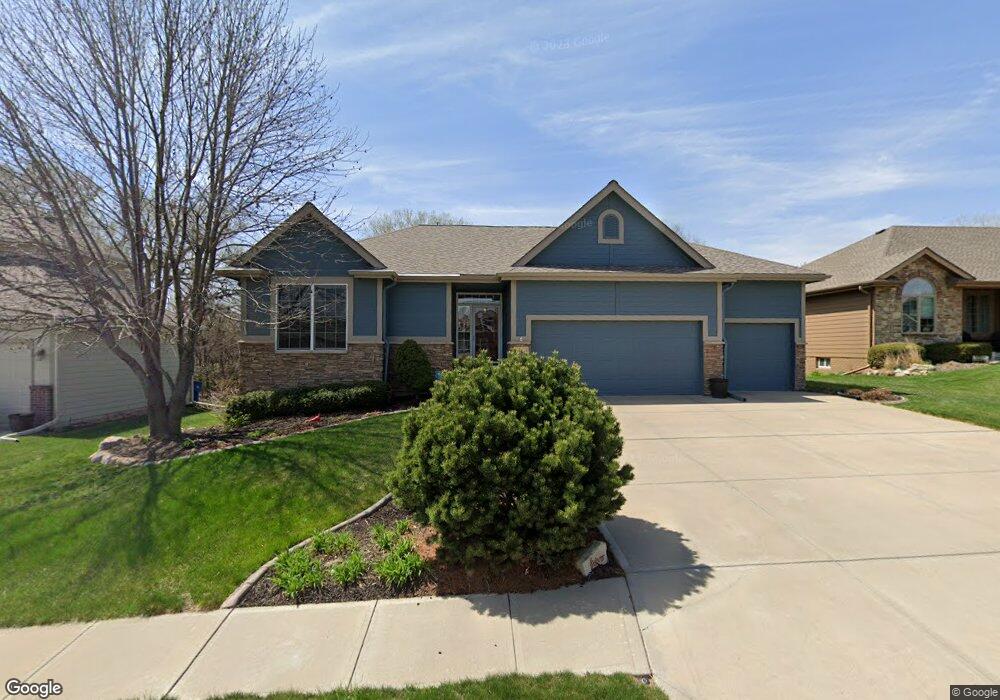
This home is located at 6922 197 St, Omaha, NE 68028 and is currently estimated at $487,701, approximately $240 per square foot. 6922 197 St is a home located in Sarpy County with nearby schools including Reeder Elementary School, Beadle Middle School, and Millard West High School.
Ownership History
Date
Name
Owned For
Owner Type
Purchase Details
Closed on
Mar 3, 2013
Sold by
Maier Scott E and Maier Theresa A
Bought by
Bacon Joseph H
Current Estimated Value
Home Financials for this Owner
Home Financials are based on the most recent Mortgage that was taken out on this home.
Original Mortgage
$228,000
Outstanding Balance
$104,207
Interest Rate
3.44%
Estimated Equity
$383,494
Purchase Details
Closed on
Nov 3, 2010
Sold by
Downing Deborah
Bought by
Maier Scott E and Maier Theresa A
Home Financials for this Owner
Home Financials are based on the most recent Mortgage that was taken out on this home.
Original Mortgage
$225,600
Interest Rate
4.32%
Purchase Details
Closed on
May 7, 2007
Sold by
Tru Vision Custom Homes Llc
Bought by
Downing Deborah
Purchase Details
Closed on
Jun 13, 2006
Sold by
Bellbrook Development Llc
Bought by
Tru Vision Custom Homes Llc
Create a Home Valuation Report for This Property
The Home Valuation Report is an in-depth analysis detailing your home's value as well as a comparison with similar homes in the area
Home Values in the Area
Average Home Value in this Area
Purchase History
| Date | Buyer | Sale Price | Title Company |
|---|---|---|---|
| Bacon Joseph H | $285,000 | Omaha Title & Escrow Inc | |
| Maier Scott E | $282,000 | Nlta | |
| Downing Deborah | $298,000 | Ots | |
| Tru Vision Custom Homes Llc | $52,000 | None Available |
Source: Public Records
Mortgage History
| Date | Status | Borrower | Loan Amount |
|---|---|---|---|
| Open | Bacon Joseph H | $228,000 | |
| Previous Owner | Maier Scott E | $225,600 |
Source: Public Records
Tax History
| Year | Tax Paid | Tax Assessment Tax Assessment Total Assessment is a certain percentage of the fair market value that is determined by local assessors to be the total taxable value of land and additions on the property. | Land | Improvement |
|---|---|---|---|---|
| 2025 | $7,052 | $442,020 | $88,000 | $354,020 |
| 2024 | $7,730 | $428,044 | $88,000 | $340,044 |
| 2023 | $7,730 | $385,885 | $75,000 | $310,885 |
| 2022 | $7,584 | $351,557 | $70,000 | $281,557 |
| 2021 | $7,178 | $329,102 | $68,500 | $260,602 |
| 2020 | $7,281 | $325,582 | $68,500 | $257,082 |
| 2019 | $6,924 | $308,980 | $68,500 | $240,480 |
| 2018 | $7,571 | $325,773 | $59,000 | $266,773 |
| 2017 | $7,601 | $320,615 | $59,000 | $261,615 |
| 2016 | $7,581 | $317,947 | $57,000 | $260,947 |
| 2015 | $7,748 | $315,361 | $57,000 | $258,361 |
| 2014 | $7,866 | $306,845 | $57,000 | $249,845 |
| 2012 | -- | $295,049 | $53,000 | $242,049 |
Source: Public Records
Map
Nearby Homes
- 19614 Chandler St
- 6709 S 199th Ave
- 20003 Polk St
- 19920 Tyler St
- 7103 S 193rd St
- 6515 S 199th Ave
- 19969 Monroe St
- 20970 Polk St
- 20973 Polk St
- 7606 S 195th St
- 4545 S 203rd St
- 4505 S 203rd St
- 4549 S 203rd St
- 4522 S 203rd St
- 4538 S 203rd St
- 19750 Bellbrook Blvd
- 6702 S 200th Ave
- 6614 S 200th Ave
- 6610 S 200th Ave
- 10416 S 191st St
- 6922 S 197 St
- 6922 S 197th St
- 6926 S 197th St
- 6918 S 197th St
- 6914 S 197th St
- 6915 S 197th St
- 6915 197
- 6911 S 197th St
- 6910 S 197 St
- 6910 197 St
- 19606 Audrey St
- 19621 Audrey St
- 19627 Brookside Ln
- 6906 S 197th St
- 19623 Brookside Ln
- 6919 197 Cir
- 6919 S 197th Cir
- 6919 S 197 Cir
- 19617 Audrey St
- 19602 Audrey St
Your Personal Tour Guide
Ask me questions while you tour the home.