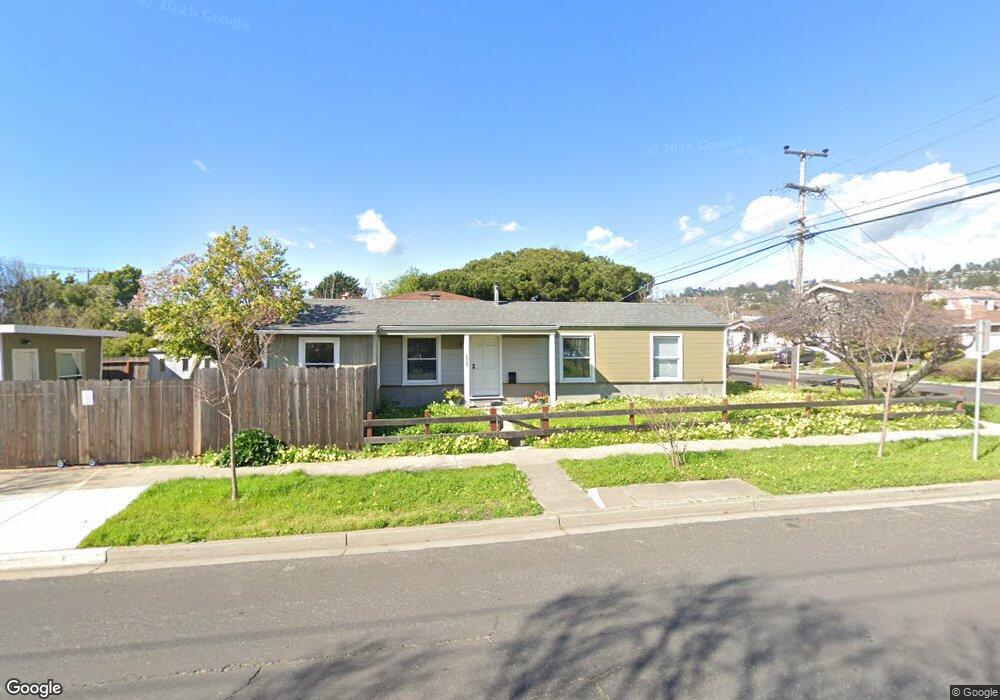
6923 Central Ave El Cerrito, CA 94530
Estimated Value: $597,000 - $940,000
2
Beds
1
Bath
781
Sq Ft
$942/Sq Ft
Est. Value
About This Home
This home is located at 6923 Central Ave, El Cerrito, CA 94530 and is currently estimated at $735,660, approximately $941 per square foot. 6923 Central Ave is a home located in Contra Costa County with nearby schools including Harding Elementary School, Fred T. Korematsu Middle School, and El Cerrito Senior High School.
Ownership History
Date
Name
Owned For
Owner Type
Purchase Details
Closed on
Oct 15, 2008
Sold by
Maac Charito and Pollock Charito
Bought by
Pollock Richard
Current Estimated Value
Purchase Details
Closed on
Oct 12, 2005
Sold by
Pollock Richard
Bought by
Pollock Richard and Pollock Charito
Home Financials for this Owner
Home Financials are based on the most recent Mortgage that was taken out on this home.
Original Mortgage
$385,000
Outstanding Balance
$204,769
Interest Rate
5.66%
Mortgage Type
Negative Amortization
Estimated Equity
$530,891
Purchase Details
Closed on
Sep 30, 1997
Sold by
Shem Jacob H and Shem Tina C
Bought by
Pollock Richard and Pollock Charito M
Home Financials for this Owner
Home Financials are based on the most recent Mortgage that was taken out on this home.
Original Mortgage
$134,800
Interest Rate
7.44%
Mortgage Type
Purchase Money Mortgage
Create a Home Valuation Report for This Property
The Home Valuation Report is an in-depth analysis detailing your home's value as well as a comparison with similar homes in the area
Home Values in the Area
Average Home Value in this Area
Purchase History
| Date | Buyer | Sale Price | Title Company |
|---|---|---|---|
| Pollock Richard | -- | None Available | |
| Pollock Richard | -- | Placer Title | |
| Pollock Richard | -- | Placer Title | |
| Pollock Richard | $139,000 | Old Republic Title |
Source: Public Records
Mortgage History
| Date | Status | Borrower | Loan Amount |
|---|---|---|---|
| Open | Pollock Richard | $385,000 | |
| Previous Owner | Pollock Richard | $134,800 |
Source: Public Records
Tax History Compared to Growth
Tax History
| Year | Tax Paid | Tax Assessment Tax Assessment Total Assessment is a certain percentage of the fair market value that is determined by local assessors to be the total taxable value of land and additions on the property. | Land | Improvement |
|---|---|---|---|---|
| 2025 | $3,804 | $221,923 | $159,665 | $62,258 |
| 2024 | $3,740 | $217,573 | $156,535 | $61,038 |
| 2023 | $3,740 | $213,308 | $153,466 | $59,842 |
| 2022 | $3,654 | $209,126 | $150,457 | $58,669 |
| 2021 | $3,608 | $205,026 | $147,507 | $57,519 |
| 2019 | $3,369 | $198,947 | $143,133 | $55,814 |
| 2018 | $3,247 | $195,047 | $140,327 | $54,720 |
| 2017 | $3,201 | $191,224 | $137,576 | $53,648 |
| 2016 | $3,180 | $187,476 | $134,879 | $52,597 |
| 2015 | $3,186 | $184,660 | $132,853 | $51,807 |
| 2014 | $3,161 | $181,044 | $130,251 | $50,793 |
Source: Public Records
Map
Nearby Homes
- 444 Richmond St
- 556 Norvell St
- 617 Albemarle St
- 619 Norvell St
- 618 Liberty St
- 10300 San Pablo Ave Unit 108
- 10300 San Pablo Ave Unit 303
- 417 Evelyn Ave Unit 205
- 115 Behrens St
- 7347 Terrace Dr
- 3014 Santa Clara Ave
- 6727 Waldo Ave
- 518 Kains Ave Unit 103
- 5720 El Dorado Ave
- 606 Masonic Ave
- 6124 Santa Cruz Ave
- 876 Balra Dr
- 951 Lexington Ave
- 7553 Stockton Ave
- 1252 Portland Ave