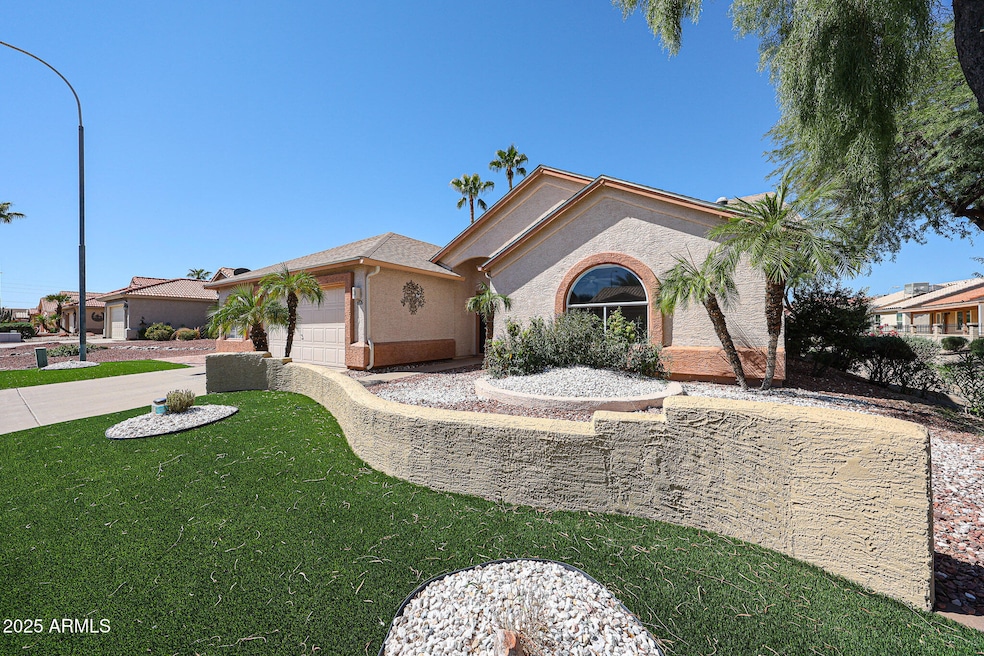
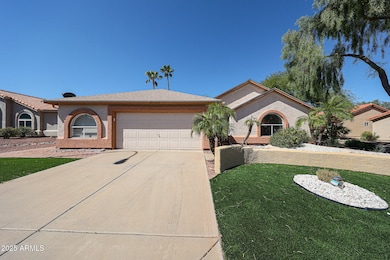
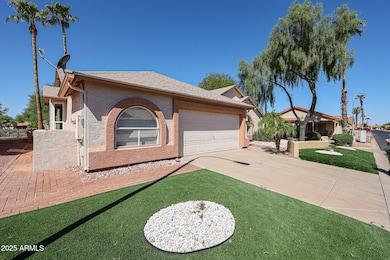
6926 S Oakmont Dr Unit 15 Chandler, AZ 85249
South Chandler NeighborhoodEstimated payment $2,228/month
Highlights
- Golf Course Community
- Gated with Attendant
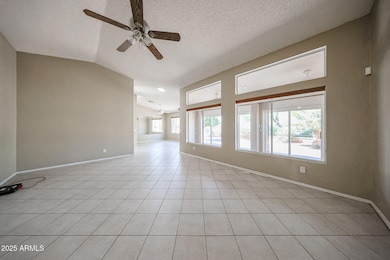
- Vaulted Ceiling
- Jane D. Hull Elementary School Rated A
- Theater or Screening Room
- Heated Community Pool
About This Home
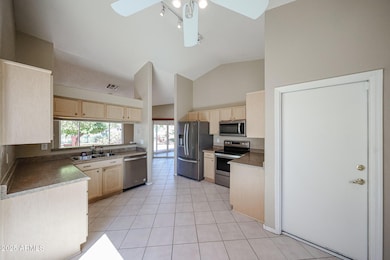
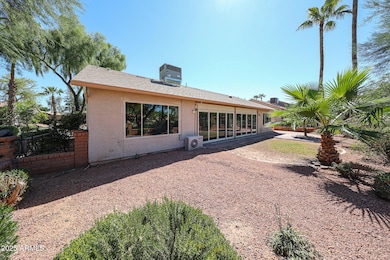
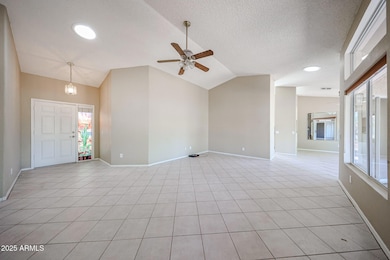
Charming home with open and welcoming floor plan. Spacious great room with formal dining room. Kitchen has generous eat-in area, walk-in pantry, plenty of cabinets and stainless-steel appliances including built-in microwave and refrigerator. Primary suite has sliding glass doors to air-conditioned Arizona room, walk-in closet and bathroom with dual sinks. Newer roof and AC, dual pane windows with custom window treatments from 3 Day Blinds. There are so many amenities in the guard gated community including heated pool and spa, tennis courts, post office and so much more.
Listing Agent
eXp Realty Brokerage Phone: 480-596-5751 License #SA116603000 Listed on: 09/26/2025

Open House Schedule
-
Sunday, November 16, 20251:00 to 4:00 pm11/16/2025 1:00:00 PM +00:0011/16/2025 4:00:00 PM +00:00Add to Calendar
Home Details
Home Type
- Single Family
Est. Annual Taxes
- $1,929
Year Built
- Built in 1996
Lot Details
- 5,528 Sq Ft Lot
- Wrought Iron Fence
- Artificial Turf
- Front and Back Yard Sprinklers
HOA Fees
- $118 Monthly HOA Fees
Parking
- 2 Car Direct Access Garage
- Garage Door Opener
Home Design
- Wood Frame Construction
- Composition Roof
- Stucco
Interior Spaces
- 1,667 Sq Ft Home
- 1-Story Property
- Vaulted Ceiling
- Double Pane Windows
Kitchen
- Eat-In Kitchen
- Walk-In Pantry
- Built-In Electric Oven
- Built-In Microwave
- Laminate Countertops
Flooring
- Laminate
- Tile
Bedrooms and Bathrooms
- 2 Bedrooms
- Primary Bathroom is a Full Bathroom
- 2 Bathrooms
- Dual Vanity Sinks in Primary Bathroom
Outdoor Features
- Patio
Schools
- Adult Elementary And Middle School
- Adult High School
Utilities
- Central Air
- Heating Available
- High Speed Internet
- Cable TV Available
Listing and Financial Details
- Home warranty included in the sale of the property
- Tax Lot 25
- Assessor Parcel Number 303-73-761
Community Details
Overview
- Association fees include ground maintenance
- Sunbird HOA, Phone Number (480) 802-4901
- Built by Robson
- Sunbird Subdivision
Amenities
- Theater or Screening Room
- Recreation Room
Recreation
- Golf Course Community
- Tennis Courts
- Pickleball Courts
- Heated Community Pool
- Community Spa
- Bike Trail
Security
- Gated with Attendant
Map
Home Values in the Area
Average Home Value in this Area
Tax History
| Year | Tax Paid | Tax Assessment Tax Assessment Total Assessment is a certain percentage of the fair market value that is determined by local assessors to be the total taxable value of land and additions on the property. | Land | Improvement |
|---|---|---|---|---|
| 2025 | $1,955 | $24,766 | -- | -- |
| 2024 | $1,889 | $23,586 | -- | -- |
| 2023 | $1,889 | $32,730 | $6,540 | $26,190 |
| 2022 | $1,824 | $25,610 | $5,120 | $20,490 |
| 2021 | $1,906 | $23,510 | $4,700 | $18,810 |
| 2020 | $1,897 | $21,960 | $4,390 | $17,570 |
| 2019 | $1,825 | $19,180 | $3,830 | $15,350 |
| 2018 | $1,766 | $18,550 | $3,710 | $14,840 |
| 2017 | $1,647 | $17,680 | $3,530 | $14,150 |
| 2016 | $1,587 | $19,200 | $3,840 | $15,360 |
| 2015 | $1,536 | $17,770 | $3,550 | $14,220 |
Property History
| Date | Event | Price | List to Sale | Price per Sq Ft |
|---|---|---|---|---|
| 11/06/2025 11/06/25 | Price Changed | $369,900 | -1.4% | $222 / Sq Ft |
| 10/17/2025 10/17/25 | Price Changed | $375,000 | -3.8% | $225 / Sq Ft |
| 10/10/2025 10/10/25 | Price Changed | $389,900 | -2.5% | $234 / Sq Ft |
| 09/26/2025 09/26/25 | For Sale | $399,900 | -- | $240 / Sq Ft |
Purchase History
| Date | Type | Sale Price | Title Company |
|---|---|---|---|
| Warranty Deed | $178,000 | First American Title Ins Co | |
| Interfamily Deed Transfer | -- | Security Title Agency | |
| Warranty Deed | $127,074 | First American Title |
Mortgage History
| Date | Status | Loan Amount | Loan Type |
|---|---|---|---|
| Open | $123,000 | New Conventional | |
| Previous Owner | $101,600 | New Conventional |
Source: Arizona Regional Multiple Listing Service (ARMLS)
MLS Number: 6925146
APN: 303-73-761
Disclaimer: Certain information contained herein is derived from information provided by parties other than Homes.com. All information provided is deemed reliable, but is not guaranteed to be accurate and should be independently verified.
![]() All information should be verified by the recipient and none is guaranteed as accurate by ARMLS
All information should be verified by the recipient and none is guaranteed as accurate by ARMLS
Listing Information presented by local MLS brokerage: Ten-X, local REALTOR®- Arlene Richardson - (888)-952-6393
- 1807 E Lindrick Dr
- 1792 E Palm Beach Dr
- 2041 E Palm Beach Dr
- 1831 E Kerby Farms Rd
- 1881 E Kerby Farms Rd
- 1941 E Kerby Farms Rd
- 1757 E Palm Beach Dr
- 1753 E Palm Beach Dr
- 2163 E Firestone Dr
- 6942 S Championship Dr
- 6711 S Coral Gable Dr
- 1880 E Winged Foot Dr
- 1863 E Buena Vista Dr
- 2258 E Gleneagle Dr
- 1553 E Palm Beach Dr
- 1562 E Gleneagle Dr
- 6581 S Salt Cedar Place
- 1543 E Gleneagle Dr
- 6512 S Sawgrass Dr
- 1541 E Colonial Dr
- 6973 S Oakmont Dr
- 1802 E Peach Tree Dr
- 1692 E Palm Beach Dr
- 1800 E Winged Foot Dr
- 2280 E Hazeltine Way
- 2286 E Peach Tree Dr
- 6621 S Championship Dr
- 2319 E Palm Beach Dr
- 2057 E Riviera Dr
- 2358 E Peach Tree Dr
- 6502 S Oakmont Dr
- 2415 E Palm Beach Dr
- 2425 E Hazeltine Way
- 2467 E Peach Tree Dr
- 6381 S Championship Dr
- 6275 S Salt Cedar Place
- 1461 E La Costa Dr
- 6481 S Windstream Place
- 2593 E Riviera Dr
- 6113 S Cypress Point Dr