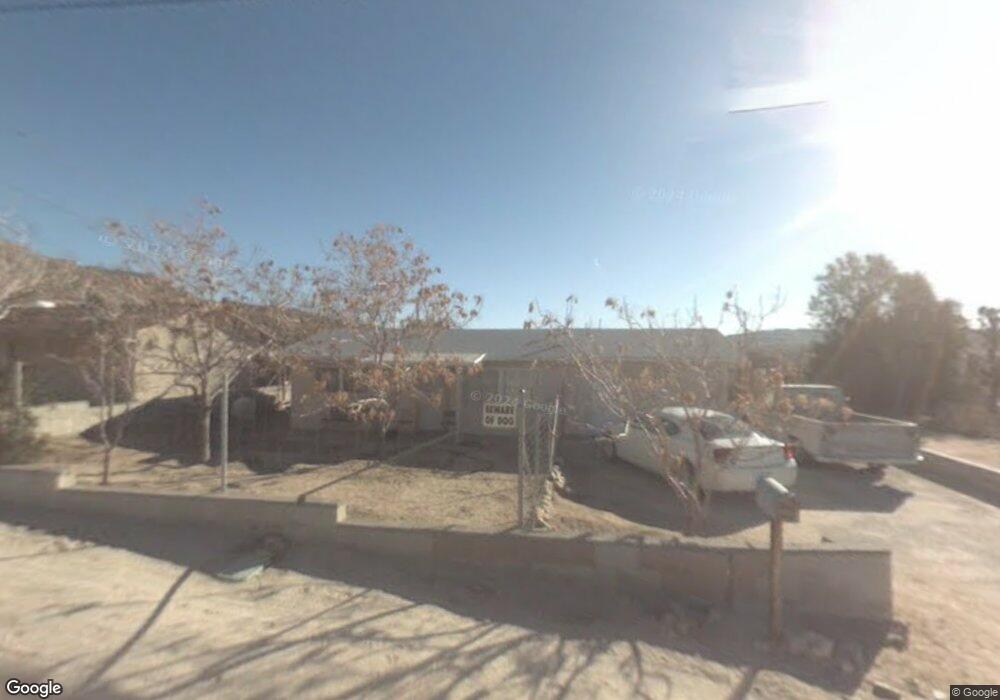
6929 Pawnee Ave Yucca Valley, CA 92284
Estimated Value: $226,000 - $285,000
1
Bed
1
Bath
798
Sq Ft
$321/Sq Ft
Est. Value
About This Home
This home is located at 6929 Pawnee Ave, Yucca Valley, CA 92284 and is currently estimated at $255,865, approximately $320 per square foot. 6929 Pawnee Ave is a home located in San Bernardino County with nearby schools including Yucca Valley Elementary School, La Contenta Middle School, and Yucca Valley High School.
Ownership History
Date
Name
Owned For
Owner Type
Purchase Details
Closed on
Apr 4, 2021
Sold by
Eubanks Douglas
Bought by
Eubanks Douglas Paul and The Douglas Eubanks Trust
Current Estimated Value
Purchase Details
Closed on
Jul 3, 2000
Sold by
The Bank Of New York
Bought by
Eubanks Douglas
Purchase Details
Closed on
Mar 28, 2000
Sold by
Voightlander Chris F Tr
Bought by
The Bank Of New York
Purchase Details
Closed on
Jan 15, 2000
Sold by
Miles Shirley
Bought by
Garcia Alfred and Wellwood Dianne
Purchase Details
Closed on
Dec 15, 1999
Sold by
Miles Shirley
Bought by
Asencio John Anthony and Johnson Lloyd
Purchase Details
Closed on
Nov 6, 1999
Sold by
Lowry Robert
Bought by
Miles Shirley and Hudson Maurice
Purchase Details
Closed on
Aug 28, 1999
Sold by
Voightlander Chris F
Bought by
Lowry Robert
Create a Home Valuation Report for This Property
The Home Valuation Report is an in-depth analysis detailing your home's value as well as a comparison with similar homes in the area
Home Values in the Area
Average Home Value in this Area
Purchase History
| Date | Buyer | Sale Price | Title Company |
|---|---|---|---|
| Eubanks Douglas Paul | -- | None Available | |
| Eubanks Douglas | $25,000 | Chicago Title Co | |
| The Bank Of New York | $16,590 | Chicago Title Co | |
| Garcia Alfred | -- | -- | |
| Garcia Alfred | $5,000 | -- | |
| Asencio John Anthony | $5,000 | -- | |
| Miles Shirley | $5,000 | -- | |
| Lowry Robert | $5,000 | -- |
Source: Public Records
Tax History Compared to Growth
Tax History
| Year | Tax Paid | Tax Assessment Tax Assessment Total Assessment is a certain percentage of the fair market value that is determined by local assessors to be the total taxable value of land and additions on the property. | Land | Improvement |
|---|---|---|---|---|
| 2025 | $2,111 | $55,330 | $7,684 | $47,646 |
| 2024 | $2,111 | $54,245 | $7,533 | $46,712 |
| 2023 | $1,971 | $53,181 | $7,385 | $45,796 |
| 2022 | $1,889 | $52,138 | $7,240 | $44,898 |
| 2021 | $1,922 | $51,116 | $7,098 | $44,018 |
| 2020 | $1,403 | $50,592 | $7,025 | $43,567 |
| 2019 | $1,185 | $49,600 | $6,887 | $42,713 |
| 2018 | $884 | $48,627 | $6,752 | $41,875 |
| 2017 | $521 | $47,674 | $6,620 | $41,054 |
| 2016 | $510 | $46,739 | $6,490 | $40,249 |
| 2015 | $497 | $46,037 | $6,393 | $39,644 |
| 2014 | $491 | $45,135 | $6,268 | $38,867 |
Source: Public Records
Map
Nearby Homes
- 6959 Pawnee Ave
- 1 Buena Vista Dr
- 5951320 Sunland Dr
- 771 Scarvan Rd
- 56254 29 Palms Hwy Unit 26
- 56254 29 Palms Hwy Unit 111
- 56254 29 Palms Hwy Unit 51
- 56254 29 Palms Hwy Unit 22
- 56254 29 Palms Hwy Unit 29
- 56254 29 Palms Hwy Unit 16
- 56254 29 Palms Hwy Unit 84
- 7156 Sioux Ave
- 6972 Tamarisk Ave
- 0 Buena Vista Dr Unit 219133815DA
- 55931 Coyote Trail
- 7243 Mohawk Trail
- 7248 Scarvan Rd
- 6966 Cholla Ave
- 7245 Church St Unit 2
- 7120 Cholla Ave
- 6919 Pawnee Ave
- 0 Pawnee Ave Unit T09127445
- 60 Pawnee
- 6934 Mohawk Trail
- 56013 Sunnyslope Dr
- 6946 Mohawk Trail
- 6922 Mohawk Trail
- 6944 Pawnee Ave
- 6958 Mohawk Trail
- 56031 Sunnyslope Dr
- 6963 Pawnee Ave
- 6916 Mohawk Trail
- 6970 Mohawk Trail
- 6975 Pawnee Ave
- 6980 Mohawk Trail
- 6929 Apache Trail
- 6913 Apache Trail
- 56063 Buena Vista Dr
- 56006 Sunnyslope Dr
- 6991 Apache Trail