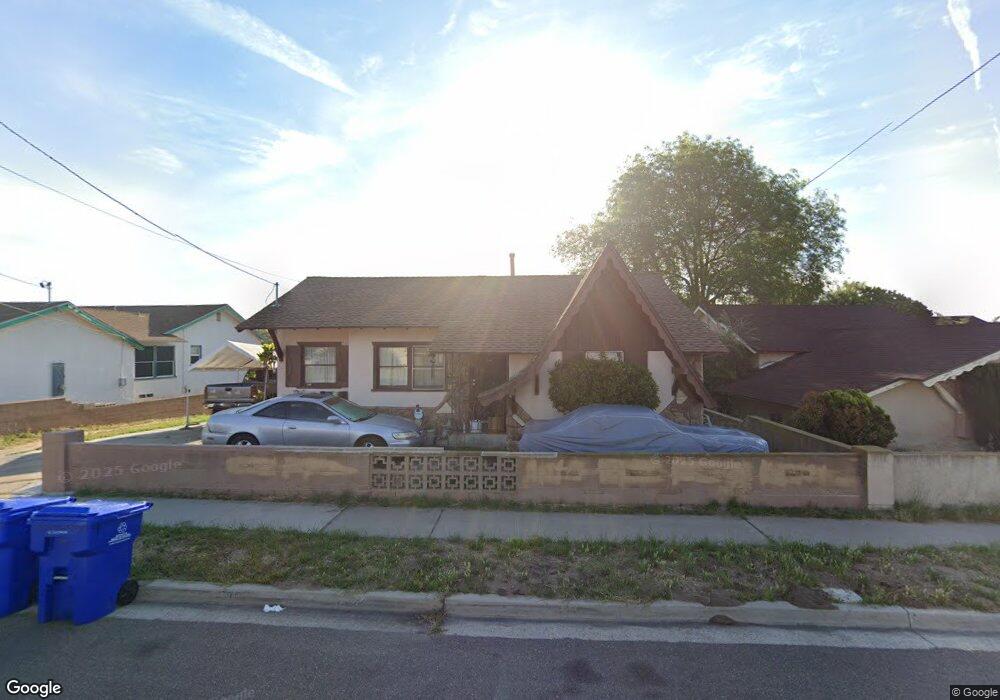
693 Pyramid St San Diego, CA 92114
Emerald Hills NeighborhoodEstimated Value: $712,838 - $780,000
3
Beds
2
Baths
1,138
Sq Ft
$657/Sq Ft
Est. Value
About This Home
This home is located at 693 Pyramid St, San Diego, CA 92114 and is currently estimated at $748,210, approximately $657 per square foot. 693 Pyramid St is a home located in San Diego County with nearby schools including Johnson Elementary School, Millennial Tech Middle School, and Lincoln High School.
Ownership History
Date
Name
Owned For
Owner Type
Purchase Details
Closed on
Mar 23, 2004
Sold by
Muro Joseph E
Bought by
Muro Joseph E and Muro Bertha
Current Estimated Value
Home Financials for this Owner
Home Financials are based on the most recent Mortgage that was taken out on this home.
Original Mortgage
$58,000
Interest Rate
4.96%
Mortgage Type
New Conventional
Purchase Details
Closed on
Sep 21, 1993
Sold by
Escobedo Nelly Castro
Bought by
Escobedo Miguel M
Purchase Details
Closed on
Jul 10, 1987
Create a Home Valuation Report for This Property
The Home Valuation Report is an in-depth analysis detailing your home's value as well as a comparison with similar homes in the area
Home Values in the Area
Average Home Value in this Area
Purchase History
| Date | Buyer | Sale Price | Title Company |
|---|---|---|---|
| Muro Joseph E | -- | Commonwealth Land Title Co | |
| Escobedo Miguel M | -- | Old Republic Title Company | |
| -- | $79,000 | -- |
Source: Public Records
Mortgage History
| Date | Status | Borrower | Loan Amount |
|---|---|---|---|
| Closed | Muro Joseph E | $58,000 |
Source: Public Records
Tax History Compared to Growth
Tax History
| Year | Tax Paid | Tax Assessment Tax Assessment Total Assessment is a certain percentage of the fair market value that is determined by local assessors to be the total taxable value of land and additions on the property. | Land | Improvement |
|---|---|---|---|---|
| 2025 | $1,785 | $151,188 | $93,783 | $57,405 |
| 2024 | $1,785 | $148,225 | $91,945 | $56,280 |
| 2023 | $1,742 | $145,320 | $90,143 | $55,177 |
| 2022 | $1,694 | $142,472 | $88,376 | $54,096 |
| 2021 | $1,680 | $139,680 | $86,644 | $53,036 |
| 2020 | $1,659 | $138,249 | $85,756 | $52,493 |
| 2019 | $1,629 | $135,539 | $84,075 | $51,464 |
| 2018 | $1,523 | $132,882 | $82,427 | $50,455 |
| 2017 | $80 | $130,277 | $80,811 | $49,466 |
| 2016 | $1,458 | $127,724 | $79,227 | $48,497 |
| 2015 | $1,436 | $125,806 | $78,037 | $47,769 |
| 2014 | $1,413 | $123,343 | $76,509 | $46,834 |
Source: Public Records
Map
Nearby Homes
- 525 Pitta St
- 5469 Roswell St
- 5454 Roswell St
- 962 Hanover St
- 5823 Roswell St
- 5863 Roswell St
- 6017 Broadway
- 5460-68 Imperial Ave
- 6117 Brooklyn Ave
- 5318 Naranja St
- 5282 Naranja St
- 5282 Naranja St Unit 3
- 5612 Zircon St
- 510 62nd St Unit 9
- 514 62nd St Unit 19
- 506 62nd St Unit 5
- 5707 Elk St
- 5922 Flipper Dr
- 5935 Flipper Dr
- 5236-38 Imperial Ave