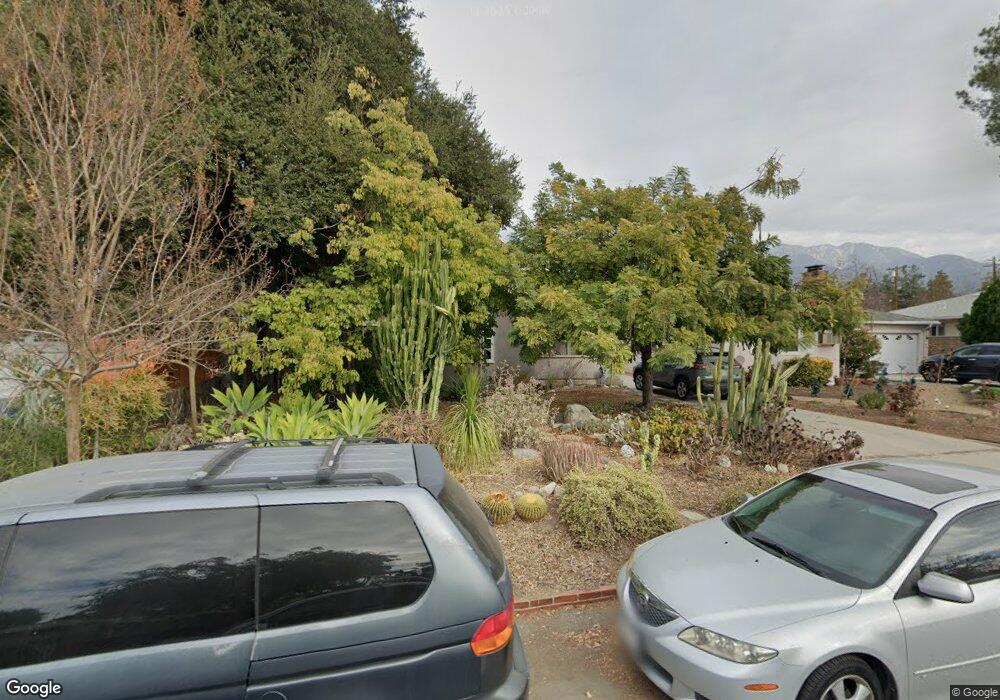
693 W Harriet St Altadena, CA 91001
Estimated Value: $530,000 - $1,018,000
3
Beds
2
Baths
1,029
Sq Ft
$834/Sq Ft
Est. Value
About This Home
This home is located at 693 W Harriet St, Altadena, CA 91001 and is currently estimated at $858,032, approximately $833 per square foot. 693 W Harriet St is a home located in Los Angeles County with nearby schools including Charles W. Eliot Arts Magnet Academy, John Muir High School, and Odyssey Charter School.
Ownership History
Date
Name
Owned For
Owner Type
Purchase Details
Closed on
Jul 26, 2013
Sold by
Martinez Kathryn
Bought by
Martinez Kathryn and Martinez Amanda Faye
Current Estimated Value
Home Financials for this Owner
Home Financials are based on the most recent Mortgage that was taken out on this home.
Original Mortgage
$278,000
Outstanding Balance
$207,315
Interest Rate
4.46%
Mortgage Type
New Conventional
Estimated Equity
$650,717
Purchase Details
Closed on
Jun 24, 1998
Sold by
Borlund Thomas V and The Borlund Family Trust
Bought by
Oconnor William D
Home Financials for this Owner
Home Financials are based on the most recent Mortgage that was taken out on this home.
Original Mortgage
$183,498
Interest Rate
6.93%
Mortgage Type
VA
Purchase Details
Closed on
Feb 14, 1996
Sold by
Borlund Thomas V and Borlund Della Rice
Bought by
Borlund Thomas V and Borlund Della Rice
Create a Home Valuation Report for This Property
The Home Valuation Report is an in-depth analysis detailing your home's value as well as a comparison with similar homes in the area
Home Values in the Area
Average Home Value in this Area
Purchase History
| Date | Buyer | Sale Price | Title Company |
|---|---|---|---|
| Martinez Kathryn | -- | First American Title Company | |
| Oconnor William D | $180,000 | Equity Title | |
| Borlund Thomas V | -- | -- |
Source: Public Records
Mortgage History
| Date | Status | Borrower | Loan Amount |
|---|---|---|---|
| Open | Martinez Kathryn | $278,000 | |
| Closed | Oconnor William D | $183,498 |
Source: Public Records
Tax History
| Year | Tax Paid | Tax Assessment Tax Assessment Total Assessment is a certain percentage of the fair market value that is determined by local assessors to be the total taxable value of land and additions on the property. | Land | Improvement |
|---|---|---|---|---|
| 2025 | $5,319 | $437,189 | $256,303 | $180,886 |
| 2024 | $5,319 | $428,618 | $251,278 | $177,340 |
| 2023 | $5,270 | $420,214 | $246,351 | $173,863 |
| 2022 | $5,091 | $411,975 | $241,521 | $170,454 |
| 2021 | $4,808 | $403,898 | $236,786 | $167,112 |
| 2019 | $4,632 | $391,920 | $229,764 | $162,156 |
| 2018 | $4,661 | $384,236 | $225,259 | $158,977 |
| 2016 | $4,506 | $369,317 | $216,513 | $152,804 |
| 2015 | $4,456 | $363,770 | $213,261 | $150,509 |
| 2014 | $4,372 | $356,645 | $209,084 | $147,561 |
Source: Public Records
Map
Nearby Homes
- 585 Mountain View St
- 637 W Altadena Dr
- 114 116 Mountain View St
- 351 W Harriet St
- 2589 El Sol Ave
- 419 W Altadena Dr
- 318 W Altadena Dr
- 337 Figueroa Dr
- 3556 Canyon Crest Rd
- 2941 Glenrose Ave
- 128 W Mendocino St
- 105 W Mariposa St
- 87 W Mariposa St
- 309 Acacia St
- 461 W Loma Alta Dr
- 2415 Fair Oaks Ave
- 2246 Glenrose Ave
- 2252 Glenrose Ave
- 4 La Venezia Ct
- 344 W Loma Alta Dr
- 685 W Harriet St
- 707 W Harriet St
- 679 W Harriet St
- 700 W Mendocino St
- 706 W Mendocino St
- 690 W Mendocino St
- 669 W Harriet St
- 712 W Mendocino St
- 678 W Mendocino St
- 694 W Harriet St
- 702 W Harriet St
- 684 W Harriet St
- 661 W Harriet St
- 2900 Casitas Ave
- 2916 Casitas Ave
- 2908 Casitas Ave
- 710 W Harriet St
- 678 W Harriet St
- 2924 Casitas Ave
- 720 W Harriet St
Your Personal Tour Guide
Ask me questions while you tour the home.