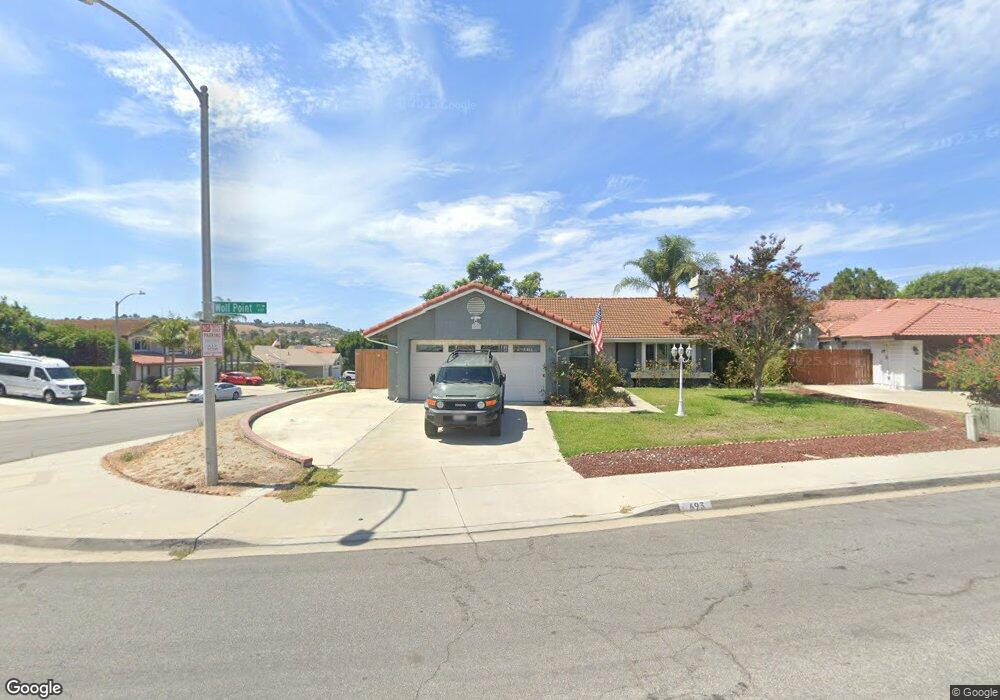
693 Wolf Point Ct Oceanside, CA 92057
Guajome NeighborhoodEstimated Value: $874,681 - $949,000
3
Beds
2
Baths
1,551
Sq Ft
$594/Sq Ft
Est. Value
About This Home
This home is located at 693 Wolf Point Ct, Oceanside, CA 92057 and is currently estimated at $920,670, approximately $593 per square foot. 693 Wolf Point Ct is a home located in San Diego County with nearby schools including Alamosa Park Elementary School, Roosevelt Middle School, and Vista High School.
Ownership History
Date
Name
Owned For
Owner Type
Purchase Details
Closed on
May 25, 2015
Sold by
Davis Bart C and Davis Ursula D G
Bought by
Solberg Trevor and Dominguez Jasmine
Current Estimated Value
Home Financials for this Owner
Home Financials are based on the most recent Mortgage that was taken out on this home.
Original Mortgage
$403,750
Outstanding Balance
$312,047
Interest Rate
3.77%
Mortgage Type
New Conventional
Estimated Equity
$608,623
Purchase Details
Closed on
May 24, 2011
Sold by
Payne Roger G and Payne Elizabeth L
Bought by
Davis Bart C and Davis Ursula D G
Home Financials for this Owner
Home Financials are based on the most recent Mortgage that was taken out on this home.
Original Mortgage
$337,095
Interest Rate
4.5%
Mortgage Type
VA
Purchase Details
Closed on
Sep 24, 2000
Sold by
Cipriani Carlo B
Bought by
Payne Roger G and Payne Elizabeth L
Home Financials for this Owner
Home Financials are based on the most recent Mortgage that was taken out on this home.
Original Mortgage
$228,000
Interest Rate
7.98%
Purchase Details
Closed on
Aug 29, 1988
Create a Home Valuation Report for This Property
The Home Valuation Report is an in-depth analysis detailing your home's value as well as a comparison with similar homes in the area
Home Values in the Area
Average Home Value in this Area
Purchase History
| Date | Buyer | Sale Price | Title Company |
|---|---|---|---|
| Solberg Trevor | $425,000 | Ticor Title San Diego | |
| Davis Bart C | $330,000 | Ticor Title | |
| Payne Roger G | $243,000 | Lawyers Title | |
| -- | $130,500 | -- |
Source: Public Records
Mortgage History
| Date | Status | Borrower | Loan Amount |
|---|---|---|---|
| Open | Solberg Trevor | $403,750 | |
| Previous Owner | Davis Bart C | $337,095 | |
| Previous Owner | Payne Roger G | $228,000 |
Source: Public Records
Tax History
| Year | Tax Paid | Tax Assessment Tax Assessment Total Assessment is a certain percentage of the fair market value that is determined by local assessors to be the total taxable value of land and additions on the property. | Land | Improvement |
|---|---|---|---|---|
| 2025 | $5,578 | $510,776 | $172,205 | $338,571 |
| 2024 | $5,578 | $500,762 | $168,829 | $331,933 |
| 2023 | $5,446 | $490,944 | $165,519 | $325,425 |
| 2022 | $5,431 | $481,319 | $162,274 | $319,045 |
| 2021 | $5,313 | $471,883 | $159,093 | $312,790 |
| 2020 | $5,294 | $467,045 | $157,462 | $309,583 |
| 2019 | $5,217 | $457,888 | $154,375 | $303,513 |
| 2018 | $4,981 | $448,911 | $151,349 | $297,562 |
| 2017 | $4,951 | $440,110 | $148,382 | $291,728 |
| 2016 | $4,838 | $431,481 | $145,473 | $286,008 |
| 2015 | $3,875 | $344,881 | $116,276 | $228,605 |
| 2014 | -- | $338,126 | $113,999 | $224,127 |
Source: Public Records
Map
Nearby Homes
- 5005 Codorniz Way Unit 8
- 5010 Golondrina Way Unit 64
- 872 Oro Grande St
- 5166 Via Portola
- 652 Montage Rd
- 761 Masters Dr
- 838 Masters Dr
- 1852 Red Willow Way
- 5349 Gooseberry Way
- 5392 Gooseberry Way
- 4791 Macadamia Ct
- 209 Madison St
- 254 Saguaro Place
- 4802 Baroque Terrace
- 104 Mellano Way
- 103 Arlow Way
- 5462 Mae Way
- 110 Takamasa Way
- 111 Metz Way
- 255 Flame Tree Place
- 5236 Silver Bluff Dr
- 683 Wolf Point Ct
- 5239 Silver Bluff Dr
- 5235 Silver Bluff Dr
- 5232 Silver Bluff Dr
- 5243 Silver Bluff Dr
- 684 Wolf Point Ct
- 696 Wolf Point Ct
- 5231 Silver Bluff Dr
- 692 Wolf Point Ct
- 5081 Caspian Dr
- 5224 Alamosa Park Dr
- 5085 Caspian Dr
- 688 Wolf Point Ct
- 5228 Silver Bluff Dr
- 620 Naples Ct
- 767 Cuchillo St
- 5220 Alamosa Park Dr
- 5228 Alamosa Park Dr
- 630 Naples Ct
Your Personal Tour Guide
Ask me questions while you tour the home.