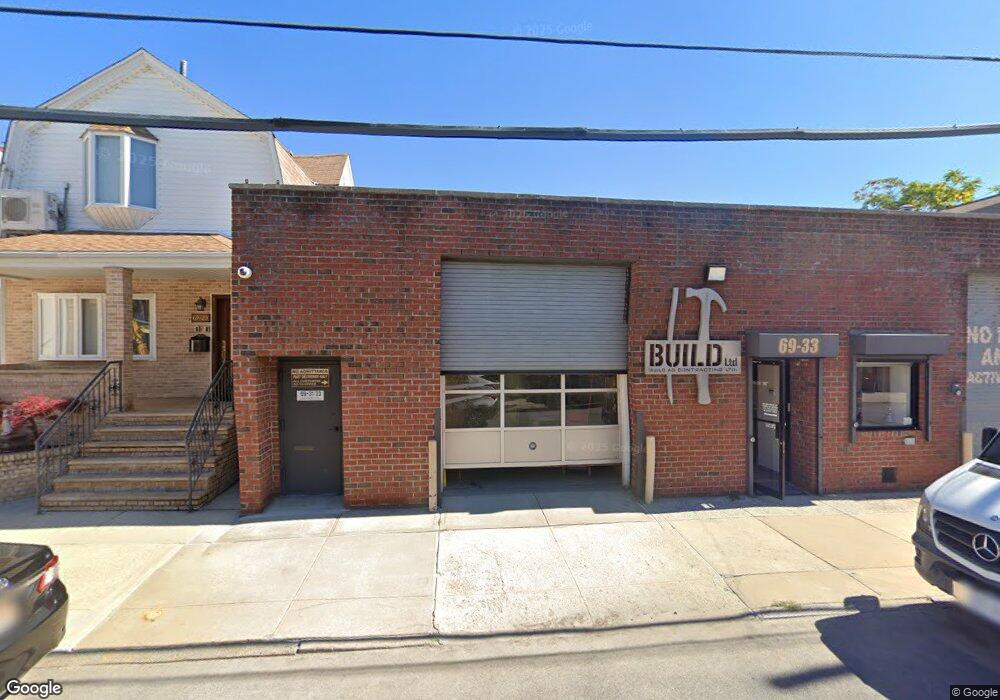
6933 76th St Flushing, NY 11379
Middle Village NeighborhoodEstimated Value: $1,884,103
Studio
--
Bath
3,800
Sq Ft
$496/Sq Ft
Est. Value
About This Home
This home is located at 6933 76th St, Flushing, NY 11379 and is currently estimated at $1,884,103, approximately $495 per square foot. 6933 76th St is a home located in Queens County with nearby schools including P.S. 87 - Middle Village, Queens Metropolitan High School, and Elm Community Charter School.
Ownership History
Date
Name
Owned For
Owner Type
Purchase Details
Closed on
Oct 3, 2023
Sold by
693 76Th Street Llc
Bought by
59-27 55Th Street Llc
Current Estimated Value
Home Financials for this Owner
Home Financials are based on the most recent Mortgage that was taken out on this home.
Original Mortgage
$750,000
Outstanding Balance
$735,446
Interest Rate
7.19%
Mortgage Type
Purchase Money Mortgage
Estimated Equity
$1,148,657
Purchase Details
Closed on
Jan 1, 2019
Sold by
Desiderio Suzanne and Tamborino Joseph
Bought by
693 76Th Street Llc
Purchase Details
Closed on
Jul 2, 2001
Sold by
Burden Robert E
Bought by
Tamborino Joseph and Desiderio Suzanne
Home Financials for this Owner
Home Financials are based on the most recent Mortgage that was taken out on this home.
Original Mortgage
$100,000
Interest Rate
7.18%
Mortgage Type
Commercial
Create a Home Valuation Report for This Property
The Home Valuation Report is an in-depth analysis detailing your home's value as well as a comparison with similar homes in the area
Home Values in the Area
Average Home Value in this Area
Purchase History
| Date | Buyer | Sale Price | Title Company |
|---|---|---|---|
| 59-27 55Th Street Llc | $1,750,000 | -- | |
| 693 76Th Street Llc | -- | -- | |
| Tamborino Joseph | -- | -- | |
| Burden Robert E | -- | -- |
Source: Public Records
Mortgage History
| Date | Status | Borrower | Loan Amount |
|---|---|---|---|
| Open | 59-27 55Th Street Llc | $750,000 | |
| Previous Owner | Burden Robert E | $100,000 |
Source: Public Records
Tax History
| Year | Tax Paid | Tax Assessment Tax Assessment Total Assessment is a certain percentage of the fair market value that is determined by local assessors to be the total taxable value of land and additions on the property. | Land | Improvement |
|---|---|---|---|---|
| 2025 | $24,105 | $241,920 | $122,400 | $119,520 |
| 2024 | $24,105 | $227,574 | $122,400 | $105,174 |
| 2023 | $23,123 | $218,304 | $122,400 | $95,904 |
| 2022 | $23,188 | $223,650 | $122,400 | $101,250 |
| 2021 | $20,549 | $192,150 | $122,400 | $69,750 |
| 2020 | $23,566 | $223,650 | $122,400 | $101,250 |
| 2019 | $22,871 | $224,550 | $122,400 | $102,150 |
| 2018 | $20,638 | $196,290 | $72,720 | $123,570 |
| 2017 | $17,459 | $166,050 | $56,160 | $109,890 |
| 2016 | $14,418 | $166,050 | $56,160 | $109,890 |
| 2015 | $5,914 | $104,220 | $39,600 | $64,620 |
| 2014 | $5,914 | $86,400 | $39,582 | $46,818 |
Source: Public Records
Map
Nearby Homes
Your Personal Tour Guide
Ask me questions while you tour the home.