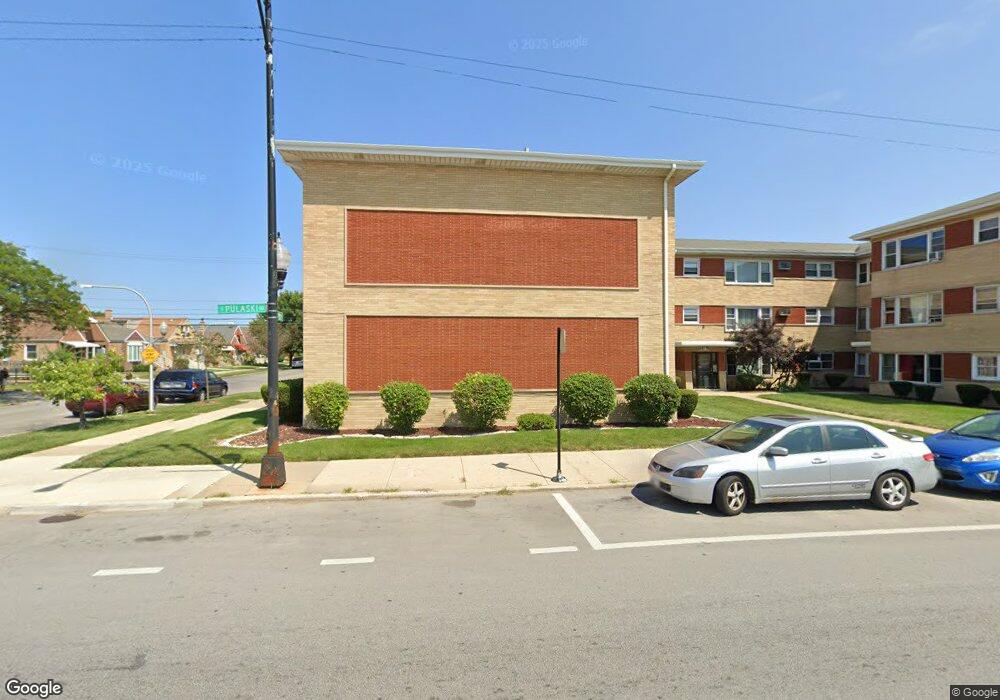
6933 S Pulaski Rd Unit 1E Chicago, IL 60629
West Lawn NeighborhoodEstimated Value: $109,000 - $130,000
1
Bed
1
Bath
19,263
Sq Ft
$6/Sq Ft
Est. Value
About This Home
This home is located at 6933 S Pulaski Rd Unit 1E, Chicago, IL 60629 and is currently estimated at $118,712, approximately $6 per square foot. 6933 S Pulaski Rd Unit 1E is a home located in Cook County with nearby schools including Hurley Elementary School, Bogan Computer Technical High School, and Queen Of The Universe School.
Ownership History
Date
Name
Owned For
Owner Type
Purchase Details
Closed on
Jan 12, 2023
Sold by
Galmaka Rentals Inc Llc
Bought by
Cruz Christian S
Current Estimated Value
Home Financials for this Owner
Home Financials are based on the most recent Mortgage that was taken out on this home.
Original Mortgage
$89,910
Outstanding Balance
$86,781
Interest Rate
6.49%
Mortgage Type
New Conventional
Estimated Equity
$31,931
Purchase Details
Closed on
Mar 27, 2018
Sold by
Galmaka Inc
Bought by
Galmaka Rentals Inc
Purchase Details
Closed on
Sep 12, 2014
Sold by
Sutton Kyla Y
Bought by
Galmaka Inc
Purchase Details
Closed on
Apr 12, 2002
Sold by
Banahan Molly
Bought by
Sutton Kyla Y
Home Financials for this Owner
Home Financials are based on the most recent Mortgage that was taken out on this home.
Original Mortgage
$63,050
Interest Rate
6.87%
Mortgage Type
Purchase Money Mortgage
Create a Home Valuation Report for This Property
The Home Valuation Report is an in-depth analysis detailing your home's value as well as a comparison with similar homes in the area
Home Values in the Area
Average Home Value in this Area
Purchase History
| Date | Buyer | Sale Price | Title Company |
|---|---|---|---|
| Cruz Christian S | $100,000 | Home Services Title | |
| Galmaka Rentals Inc | -- | None Available | |
| Galmaka Inc | $24,500 | None Available | |
| Sutton Kyla Y | $65,000 | -- |
Source: Public Records
Mortgage History
| Date | Status | Borrower | Loan Amount |
|---|---|---|---|
| Open | Cruz Christian S | $89,910 | |
| Previous Owner | Sutton Kyla Y | $63,050 |
Source: Public Records
Tax History
| Year | Tax Paid | Tax Assessment Tax Assessment Total Assessment is a certain percentage of the fair market value that is determined by local assessors to be the total taxable value of land and additions on the property. | Land | Improvement |
|---|---|---|---|---|
| 2025 | $1,319 | $9,017 | $633 | $8,384 |
| 2024 | $1,319 | $9,017 | $633 | $8,384 |
| 2023 | $1,286 | $5,500 | $791 | $4,709 |
| 2022 | $1,286 | $5,500 | $791 | $4,709 |
| 2021 | $1,252 | $5,499 | $790 | $4,709 |
| 2020 | $1,293 | $5,081 | $790 | $4,291 |
| 2019 | $1,323 | $5,728 | $790 | $4,938 |
| 2018 | $1,320 | $5,728 | $790 | $4,938 |
| 2017 | $1,130 | $4,572 | $711 | $3,861 |
| 2016 | $1,052 | $4,572 | $711 | $3,861 |
| 2015 | $982 | $4,572 | $711 | $3,861 |
| 2014 | $1,353 | $6,172 | $672 | $5,500 |
| 2013 | $1,328 | $6,172 | $672 | $5,500 |
Source: Public Records
Map
Nearby Homes
- 3801 W 69th St
- 6849 S Keeler Ave
- 6813 S Keeler Ave
- 3907 W Marquette Rd
- 7125 S Hamlin Ave
- 3815 W Marquette Rd
- 7230 S Avers Ave
- 4143 W Marquette Rd
- 7205 S Hamlin Ave
- 3631 W 69th St
- 6559 S Kedvale Ave
- 3709 W 66th Place
- 6731 S Kolin Ave
- 6815 S Kostner Ave
- 6549 S Keeler Ave
- 6724 S Kolin Ave
- 7216 S Central Park Ave
- 6822 S Kenneth Ave
- 3750 W 65th St
- 3832 W 64th Place
- 6933 S Pulaski Rd Unit 2E
- 6933 S Pulaski Rd Unit 1F
- 6933 S Pulaski Rd Unit 3F
- 6933 S Pulaski Rd Unit 2F
- 6933 S Pulaski Rd Unit 2A
- 6933 S Pulaski Rd Unit 1D
- 6937 S Pulaski Rd Unit 2C
- 6933 S Pulaski Rd Unit 3D
- 6937 S Pulaski Rd Unit 3C
- 6933 S Pulaski Rd Unit 3B
- 6935 S Pulaski Rd Unit 1B
- 6933 S Pulaski Rd Unit 2B
- 6933 S Pulaski Rd Unit 3A
- 6933 S Pulaski Rd Unit 2D
- 6933 S Pulaski Rd Unit 1C
- 6933 S Pulaski Rd Unit 1A
- 6933 S Pulaski Rd Unit F2
- 6933 S Pulaski Rd Unit D3
- 6937 S Pulaski Rd Unit C3
- 6937 S Pulaski Rd Unit C-3
Your Personal Tour Guide
Ask me questions while you tour the home.