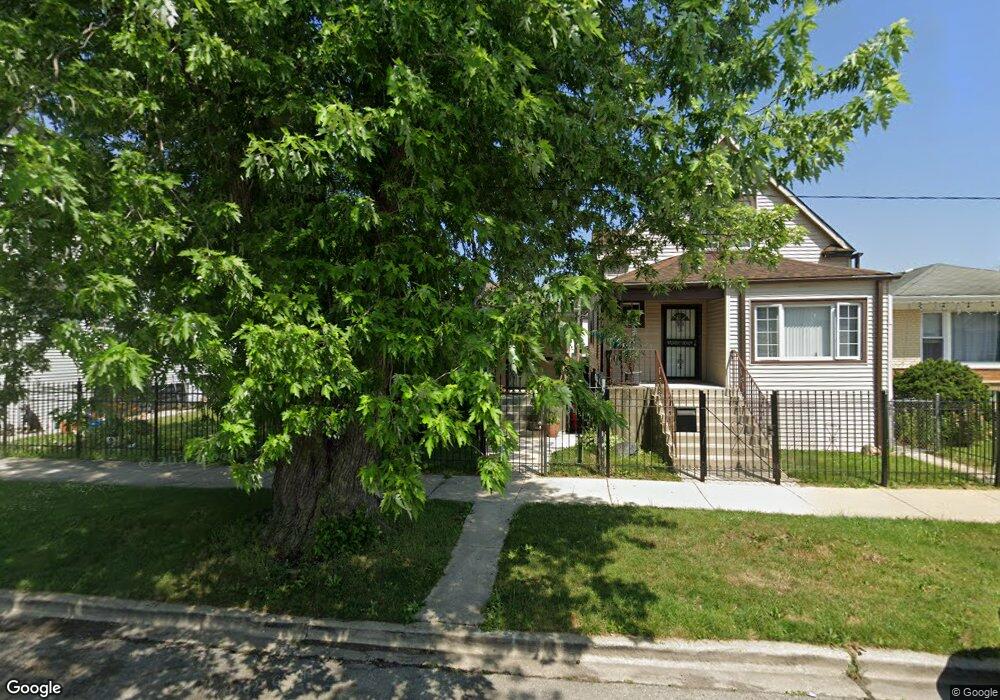
6933 S Winchester Ave Chicago, IL 60636
Englewood NeighborhoodEstimated Value: $135,000 - $183,985
2
Beds
1
Bath
1,080
Sq Ft
$153/Sq Ft
Est. Value
About This Home
This home is located at 6933 S Winchester Ave, Chicago, IL 60636 and is currently estimated at $164,996, approximately $152 per square foot. 6933 S Winchester Ave is a home located in Cook County with nearby schools including Randolph Elementary School, The Montessori School of Englewood Charter School, and Providence-Englewood Elementary Charter School.
Ownership History
Date
Name
Owned For
Owner Type
Purchase Details
Closed on
Jul 29, 2010
Sold by
Marquette Bank
Bought by
Williams Thinner
Current Estimated Value
Home Financials for this Owner
Home Financials are based on the most recent Mortgage that was taken out on this home.
Original Mortgage
$73,500
Outstanding Balance
$48,982
Interest Rate
4.7%
Mortgage Type
Seller Take Back
Estimated Equity
$116,014
Purchase Details
Closed on
Mar 2, 2010
Sold by
Marquette Bank
Bought by
Marquette Bank
Purchase Details
Closed on
Sep 26, 2005
Sold by
Williams Thinner
Bought by
Marquette Bank and Trust #16575
Purchase Details
Closed on
Feb 2, 1999
Sold by
R & Z Enterprises Inc
Bought by
Williams Thinner
Home Financials for this Owner
Home Financials are based on the most recent Mortgage that was taken out on this home.
Original Mortgage
$55,650
Interest Rate
6.94%
Purchase Details
Closed on
Jun 4, 1998
Sold by
Bankers Trust Company Of California Na
Bought by
R & Z Enterprises
Purchase Details
Closed on
Feb 24, 1994
Sold by
Va
Bought by
Bankers Trust Company Of California Na
Create a Home Valuation Report for This Property
The Home Valuation Report is an in-depth analysis detailing your home's value as well as a comparison with similar homes in the area
Home Values in the Area
Average Home Value in this Area
Purchase History
| Date | Buyer | Sale Price | Title Company |
|---|---|---|---|
| Williams Thinner | $73,500 | Old Republic National Title | |
| Marquette Bank | -- | Old Republic National Title | |
| Marquette Bank | -- | None Available | |
| Marquette Bank | -- | -- | |
| Williams Thinner | $79,500 | Professional National Title | |
| R & Z Enterprises | $30,000 | -- | |
| Bankers Trust Company Of California Na | -- | -- |
Source: Public Records
Mortgage History
| Date | Status | Borrower | Loan Amount |
|---|---|---|---|
| Open | Williams Thinner | $73,500 | |
| Previous Owner | Williams Thinner | $55,650 | |
| Closed | Williams Thinner | $15,900 |
Source: Public Records
Tax History Compared to Growth
Tax History
| Year | Tax Paid | Tax Assessment Tax Assessment Total Assessment is a certain percentage of the fair market value that is determined by local assessors to be the total taxable value of land and additions on the property. | Land | Improvement |
|---|---|---|---|---|
| 2024 | $112 | $8,201 | $938 | $7,263 |
| 2023 | $70 | $6,500 | $2,031 | $4,469 |
| 2022 | $70 | $6,500 | $2,031 | $4,469 |
| 2021 | $370 | $6,499 | $2,031 | $4,468 |
| 2020 | $370 | $6,097 | $2,031 | $4,066 |
| 2019 | $0 | $6,775 | $2,031 | $4,744 |
| 2018 | $0 | $6,775 | $2,031 | $4,744 |
| 2017 | $370 | $8,919 | $1,875 | $7,044 |
| 2016 | $793 | $8,919 | $1,875 | $7,044 |
| 2015 | $762 | $8,919 | $1,875 | $7,044 |
| 2014 | $1,096 | $8,474 | $1,718 | $6,756 |
| 2013 | $1,063 | $8,474 | $1,718 | $6,756 |
Source: Public Records
Map
Nearby Homes
- 7024 S Honore St
- 2008 W 69th Place
- 6830 S Honore St
- 6825 S Winchester Ave
- 7031 S Damen Ave
- 2020 W 69th Place
- 7049 S Damen Ave
- 7056 S Honore St
- 7015 S Wood St
- 1851 W 71st St
- 2044 W 69th St
- 1809 W 71st St
- 6805 S Wood St
- 7017 S Hermitage Ave
- 6812 S Hermitage Ave
- 2101 W 69th St
- 7002 S Paulina St
- 7139 S Winchester Ave
- 7010 S Paulina St
- 7133 S Honore St
- 6935 S Winchester Ave
- 6939 S Winchester Ave
- 6929 S Winchester Ave
- 6941 S Winchester Ave
- 6925 S Winchester Ave
- 6925 S Winchester Ave
- 6943 S Winchester Ave
- 6921 S Winchester Ave
- 6947 S Winchester Ave
- 6932 S Wolcott Ave
- 6930 S Wolcott Ave
- 6928 S Wolcott Ave
- 6928 S Wolcott Ave
- 6949 S Winchester Ave
- 6926 S Wolcott Ave
- 6940 S Wolcott Ave
- 6940 S Wolcott Ave
- 6936 S Wolcott Ave
- 6932 S Winchester Ave
- 6922 S Wolcott Ave