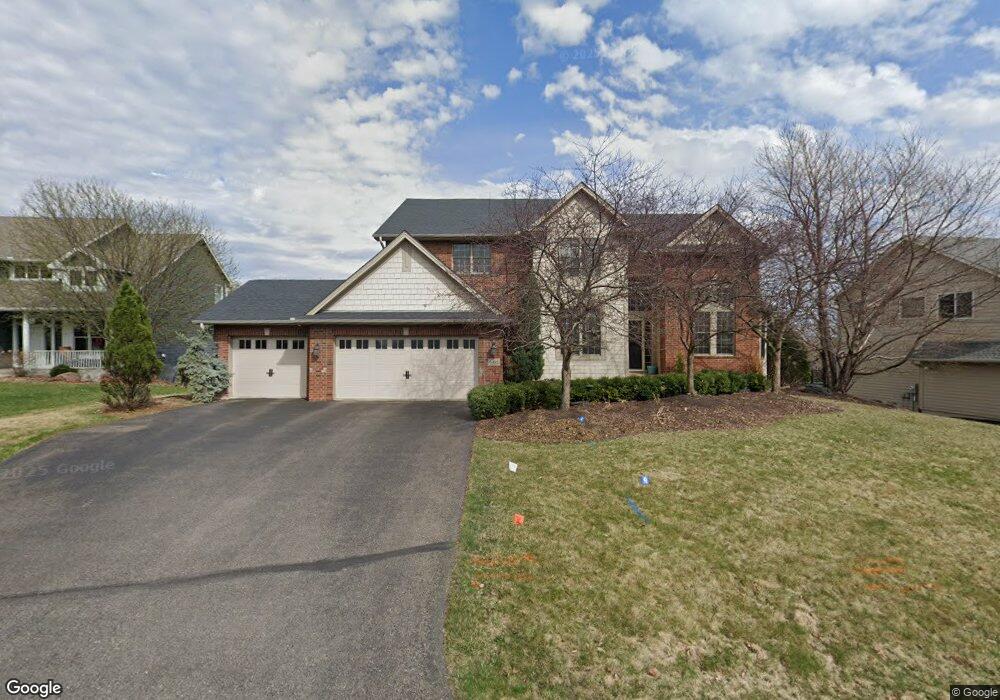
6935 Ruby Ln Chanhassen, MN 55317
Estimated Value: $916,000 - $1,070,000
4
Beds
4
Baths
3,535
Sq Ft
$285/Sq Ft
Est. Value
About This Home
This home is located at 6935 Ruby Ln, Chanhassen, MN 55317 and is currently estimated at $1,007,675, approximately $285 per square foot. 6935 Ruby Ln is a home located in Carver County with nearby schools including Excelsior Elementary School, Minnetonka West Middle School, and Minnetonka Senior High School.
Ownership History
Date
Name
Owned For
Owner Type
Purchase Details
Closed on
Jun 28, 2024
Sold by
Freebersyser James A and Treptau Michelle M
Bought by
Reiland Andrew and Reiland Julia
Current Estimated Value
Home Financials for this Owner
Home Financials are based on the most recent Mortgage that was taken out on this home.
Original Mortgage
$899,100
Outstanding Balance
$883,336
Interest Rate
6.94%
Mortgage Type
New Conventional
Estimated Equity
$124,339
Purchase Details
Closed on
Feb 25, 2005
Sold by
Lundgren Bros Construction Inc
Bought by
Freebersyser James A and Treptau Michelle M
Home Financials for this Owner
Home Financials are based on the most recent Mortgage that was taken out on this home.
Original Mortgage
$410,000
Interest Rate
5.7%
Mortgage Type
New Conventional
Purchase Details
Closed on
Nov 12, 2004
Sold by
Lundgren Bros Construction Inc
Bought by
Morken Jeffrey J and Morken Stacey J
Create a Home Valuation Report for This Property
The Home Valuation Report is an in-depth analysis detailing your home's value as well as a comparison with similar homes in the area
Home Values in the Area
Average Home Value in this Area
Purchase History
| Date | Buyer | Sale Price | Title Company |
|---|---|---|---|
| Reiland Andrew | $999,000 | Watermark Title | |
| Freebersyser James A | $771,884 | -- | |
| Morken Jeffrey J | $685,231 | -- |
Source: Public Records
Mortgage History
| Date | Status | Borrower | Loan Amount |
|---|---|---|---|
| Open | Reiland Andrew | $899,100 | |
| Previous Owner | Freebersyser James A | $410,000 |
Source: Public Records
Tax History
| Year | Tax Paid | Tax Assessment Tax Assessment Total Assessment is a certain percentage of the fair market value that is determined by local assessors to be the total taxable value of land and additions on the property. | Land | Improvement |
|---|---|---|---|---|
| 2025 | $9,944 | $958,500 | $297,000 | $661,500 |
| 2024 | $9,684 | $865,600 | $236,500 | $629,100 |
| 2023 | $9,162 | $867,400 | $236,500 | $630,900 |
| 2022 | $9,090 | $828,800 | $225,000 | $603,800 |
| 2021 | $9,074 | $735,400 | $187,500 | $547,900 |
| 2020 | $9,328 | $741,200 | $187,500 | $553,700 |
| 2019 | $8,902 | $701,500 | $178,600 | $522,900 |
| 2018 | $8,668 | $701,500 | $178,600 | $522,900 |
| 2017 | $8,862 | $678,900 | $178,600 | $500,300 |
| 2016 | $8,980 | $688,200 | $0 | $0 |
| 2015 | $9,604 | $693,200 | $0 | $0 |
| 2014 | $9,604 | $687,900 | $0 | $0 |
Source: Public Records
Map
Nearby Homes
- 1886 Della Dr
- 2121 Crestview Dr
- 6480 Yosemite
- 6456 Yosemite Ln
- 7000 Tecumseh Ln
- 6934 Highover Dr
- 7011 Highover Dr
- 7329 Bent Bow Trail
- 7483 Moccasin Trail
- 7020 Pima Ln
- 1042 Pontiac Ln
- 7428 Bent Bow Trail
- 7275 Pontiac Cir
- 7702 Bluebonnet Blvd
- 6040 Oakview Ct
- 7424 Moccasin Trail
- 7406 Moccasin Trail
- 6680 Nez Perce Dr
- 7703 Vasserman Place
- 516 Grace St
Your Personal Tour Guide
Ask me questions while you tour the home.