6937 Hunters Way Raleigh, NC 27615
Estimated Value: $474,156 - $538,000
3
Beds
3
Baths
2,338
Sq Ft
$215/Sq Ft
Est. Value
About This Home
This home is located at 6937 Hunters Way, Raleigh, NC 27615 and is currently estimated at $502,789, approximately $215 per square foot. 6937 Hunters Way is a home located in Wake County with nearby schools including North Ridge Elementary School, West Millbrook Middle School, and Millbrook High School.
Ownership History
Date
Name
Owned For
Owner Type
Purchase Details
Closed on
Nov 30, 2020
Sold by
Scheib Joseph H and Scheib Barbara H
Bought by
Vannortwick Debra B
Current Estimated Value
Purchase Details
Closed on
Sep 14, 2016
Sold by
Scheib Barbara Ayscue and Scheib Joseph Harry
Bought by
The Joseph H Scheib And Barbara A Scheib
Purchase Details
Closed on
Dec 22, 2009
Sold by
Scheib Barbara Ayscue
Bought by
Ayscue Barbara and Scheib Joseph Harry
Purchase Details
Closed on
Jan 5, 2009
Sold by
Scheib Barbara A
Bought by
Scheib Barbara Ayscue and Scheib Joseph Harry
Purchase Details
Closed on
May 24, 2000
Sold by
Goldstein Bernard
Bought by
Scheib Barbara A
Purchase Details
Closed on
Jan 25, 1999
Sold by
Goldstein Bernard
Bought by
Goldstein Bernard and Goldstein Georgia Marie
Create a Home Valuation Report for This Property
The Home Valuation Report is an in-depth analysis detailing your home's value as well as a comparison with similar homes in the area
Home Values in the Area
Average Home Value in this Area
Purchase History
| Date | Buyer | Sale Price | Title Company |
|---|---|---|---|
| Vannortwick Debra B | $320,000 | None Available | |
| The Joseph H Scheib And Barbara A Scheib | -- | None Available | |
| Ayscue Barbara | -- | None Available | |
| Scheib Barbara Ayscue | -- | None Available | |
| Scheib Barbara A | $298,000 | -- | |
| Goldstein Bernard | -- | -- |
Source: Public Records
Tax History Compared to Growth
Tax History
| Year | Tax Paid | Tax Assessment Tax Assessment Total Assessment is a certain percentage of the fair market value that is determined by local assessors to be the total taxable value of land and additions on the property. | Land | Improvement |
|---|---|---|---|---|
| 2025 | $4,167 | $475,486 | $90,000 | $385,486 |
| 2024 | $4,150 | $475,486 | $90,000 | $385,486 |
| 2023 | $3,632 | $331,364 | $70,000 | $261,364 |
| 2022 | $3,375 | $331,364 | $70,000 | $261,364 |
| 2021 | $3,244 | $331,364 | $70,000 | $261,364 |
| 2020 | $3,185 | $331,364 | $70,000 | $261,364 |
| 2019 | $3,233 | $277,257 | $75,000 | $202,257 |
| 2018 | $3,049 | $277,257 | $75,000 | $202,257 |
| 2017 | $2,904 | $277,257 | $75,000 | $202,257 |
| 2016 | $2,845 | $277,257 | $75,000 | $202,257 |
| 2015 | $3,445 | $330,724 | $75,000 | $255,724 |
| 2014 | $3,267 | $330,724 | $75,000 | $255,724 |
Source: Public Records
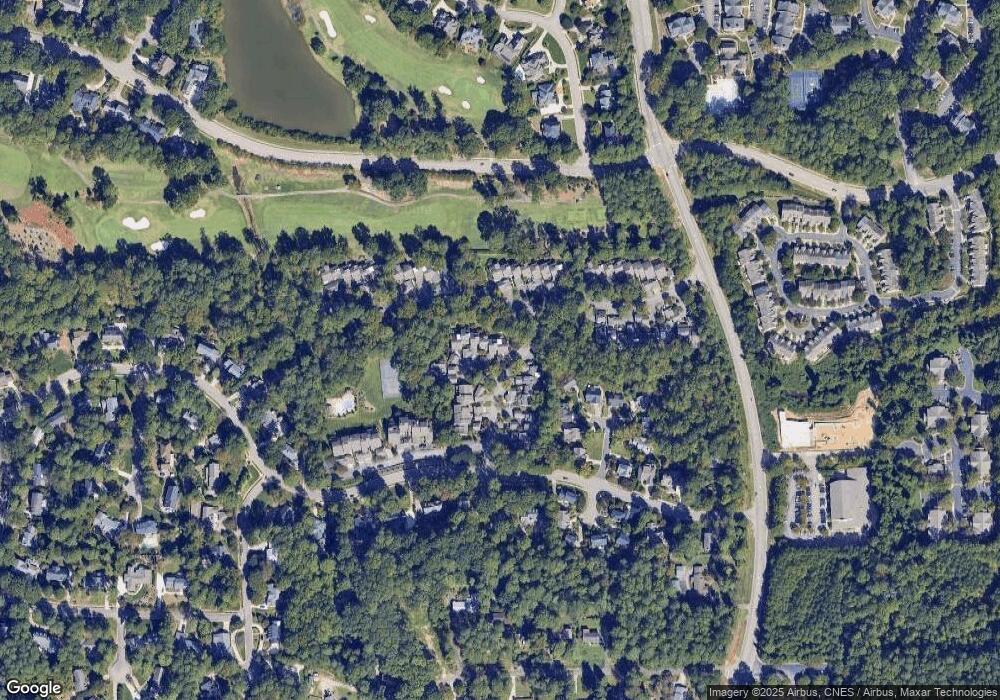
Map
Nearby Homes
- 2301 Upper Oaks Way
- 7015 Litchford Rd
- 7019 Litchford Rd
- 6904 Aspen Ct
- 7008 Racine Way
- 1925 Hunting Ridge Rd
- 6311 Johnsdale Rd
- 7316 Massachusetts Ct
- 2317 Declaration Dr
- 1820 Hunting Ridge Rd
- 2301 Declaration Dr
- 2328 Florida Ct
- 2105 Prescott Place
- 7000 N Ridge Dr
- 6844 Greystone Dr
- 1904 Merion Place
- 2516 Constitution Dr
- 7140 N Ridge Dr
- 2920 Berkeley Springs Place
- 6309 Johnsdale Rd
- 6935 Hunters Way
- 6933 Hunters Way
- 6931 Hunters Way
- 6916 Hunters Way
- 6929 Hunters Way
- 6914 Hunters Way
- 6912 Hunters Way
- 6927 Hunters Way
- 6915 Hunters Way
- 6910 Hunters Way
- 6951 Hunters Way
- 2117 Landings Way
- 6913 Hunters Way
- 6921 Hunters Way
- 6919 Hunters Way
- 6911 Hunters Way
- 7013 Saddle Springs Ct
- 6906 Hunters Way
- 6925 Hunters Way
- 6909 Hunters Way