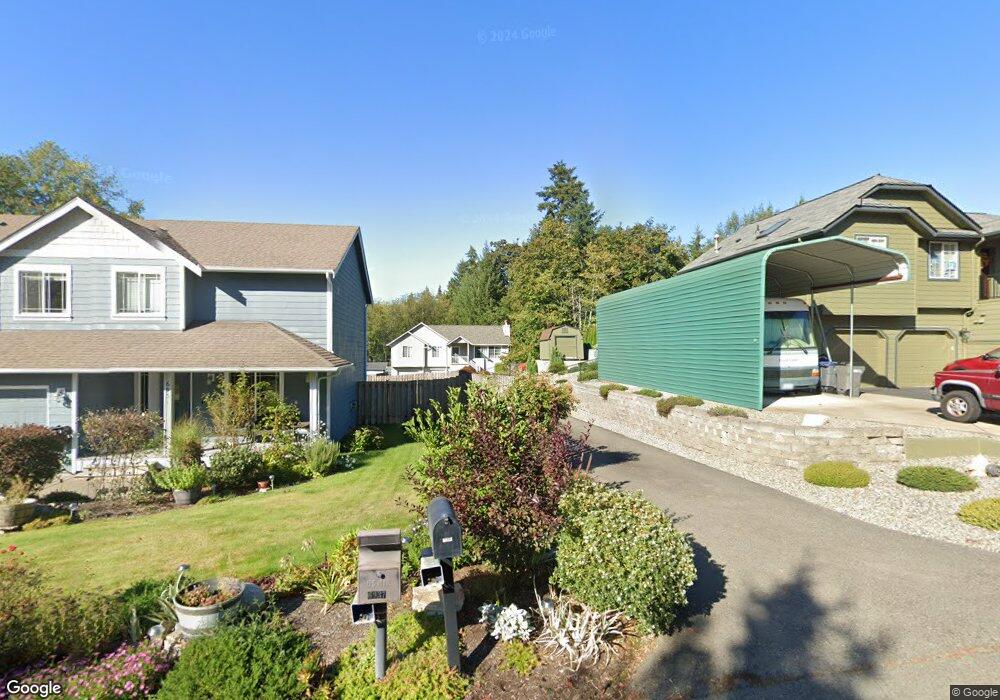
6937 SE Truman St Port Orchard, WA 98366
Manchester NeighborhoodEstimated Value: $421,000 - $475,000
2
Beds
2
Baths
1,354
Sq Ft
$335/Sq Ft
Est. Value
About This Home
This home is located at 6937 SE Truman St, Port Orchard, WA 98366 and is currently estimated at $453,117, approximately $334 per square foot. 6937 SE Truman St is a home located in Kitsap County with nearby schools including Manchester Elementary School, John Sedgwick Middle School, and South Kitsap High School.
Ownership History
Date
Name
Owned For
Owner Type
Purchase Details
Closed on
Oct 13, 1997
Sold by
Trulson Company Inc
Bought by
Peters Philip J and Peters Cynthia M
Current Estimated Value
Home Financials for this Owner
Home Financials are based on the most recent Mortgage that was taken out on this home.
Original Mortgage
$100,562
Outstanding Balance
$16,213
Interest Rate
7.49%
Mortgage Type
FHA
Estimated Equity
$436,904
Create a Home Valuation Report for This Property
The Home Valuation Report is an in-depth analysis detailing your home's value as well as a comparison with similar homes in the area
Home Values in the Area
Average Home Value in this Area
Purchase History
| Date | Buyer | Sale Price | Title Company |
|---|---|---|---|
| Peters Philip J | $101,000 | Charter Title Corp |
Source: Public Records
Mortgage History
| Date | Status | Borrower | Loan Amount |
|---|---|---|---|
| Open | Peters Philip J | $100,562 |
Source: Public Records
Tax History Compared to Growth
Tax History
| Year | Tax Paid | Tax Assessment Tax Assessment Total Assessment is a certain percentage of the fair market value that is determined by local assessors to be the total taxable value of land and additions on the property. | Land | Improvement |
|---|---|---|---|---|
| 2026 | $3,321 | $379,350 | $90,000 | $289,350 |
| 2025 | $3,321 | $379,350 | $90,000 | $289,350 |
| 2024 | $3,221 | $379,350 | $90,000 | $289,350 |
| 2023 | $3,197 | $379,350 | $90,000 | $289,350 |
| 2022 | $3,058 | $303,620 | $71,880 | $231,740 |
| 2021 | $2,822 | $264,790 | $62,500 | $202,290 |
| 2020 | $2,679 | $244,100 | $58,110 | $185,990 |
| 2019 | $2,305 | $230,640 | $54,930 | $175,710 |
| 2018 | $2,412 | $181,320 | $47,670 | $133,650 |
| 2017 | $1,998 | $181,320 | $47,670 | $133,650 |
| 2016 | $1,954 | $162,230 | $45,400 | $116,830 |
| 2015 | $1,893 | $159,420 | $45,400 | $114,020 |
| 2014 | -- | $155,300 | $46,160 | $109,140 |
| 2013 | -- | $155,300 | $46,160 | $109,140 |
Source: Public Records
Map
Nearby Homes
- 7166 E Fillmore St
- 802 California Ave SE
- 7143 SE Grant St
- 7104 SE Kansas St
- 7085 SE Legrand St
- 6521 SE Mile Hill Dr Unit 23
- 7847 SE Monte Bella Place
- 1381 Alaska Ave SE
- 1083 Puget Dr E
- 1738 Lilypad Place E
- 8009 E Commons Ct
- 5957 E Collins Rd
- 803 Collins Creek Ln E
- 71 Carson Ave SE
- 1313 Colchester Dr SE
- 8151 E Seaview Dr
- 8185 E Seaview Dr
- 7549 E Alki View Ct
- 1135 Hillandale Dr E
- 7230 E Maple St
- 6943 SE Truman St
- 6878 SE Fillmore St
- 6931 SE Truman St
- 6925 SE Truman St
- 6949 SE Truman St
- 6919 SE Truman St
- 6921 E Fillmore St
- 6893 E Fillmore St
- 825 Nebraska St SE
- 845 Nebraska St SE
- 6955 SE Truman St
- 881 Nebraska St SE
- 901 Nebraska St SE
- 6961 SE Truman St
- 6885 E Fillmore St
- 6909 E Fillmore St
- 6935 E Fillmore St
- 6935 SE Fillmore St
- 6930 SE Truman St