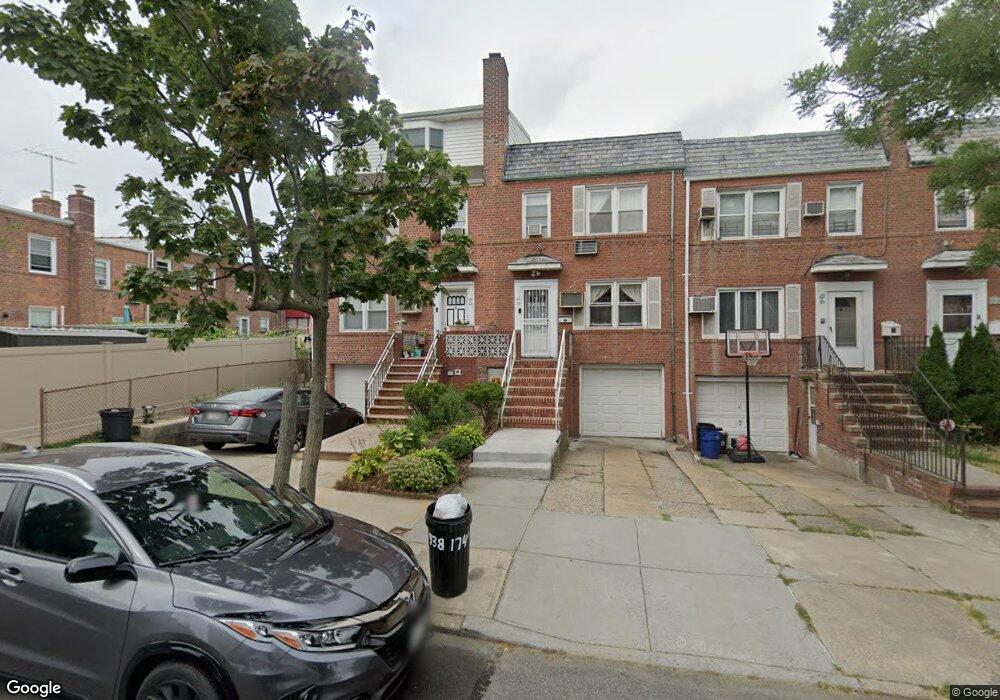
6938 174th St Fresh Meadows, NY 11365
Hillcrest NeighborhoodEstimated Value: $894,000 - $952,000
--
Bed
--
Bath
1,732
Sq Ft
$534/Sq Ft
Est. Value
About This Home
This home is located at 6938 174th St, Fresh Meadows, NY 11365 and is currently estimated at $925,257, approximately $534 per square foot. 6938 174th St is a home located in Queens County with nearby schools including P.S. 173 - Fresh Meadow, George J. Ryan Middle School 216, and Holy Family School.
Ownership History
Date
Name
Owned For
Owner Type
Purchase Details
Closed on
Aug 28, 2007
Sold by
Kwong Belinda Waichee and Kwong Patrick Tszman
Bought by
Sit Kevin Kui Fai and Sit-Lam Fandy H
Current Estimated Value
Home Financials for this Owner
Home Financials are based on the most recent Mortgage that was taken out on this home.
Original Mortgage
$200,000
Outstanding Balance
$126,307
Interest Rate
6.7%
Mortgage Type
Purchase Money Mortgage
Estimated Equity
$798,950
Purchase Details
Closed on
Aug 14, 1996
Sold by
Manolis Demetrios and Manolis Ann
Bought by
Kwong Patrick Tszman and Kwong Belinda Waichee
Home Financials for this Owner
Home Financials are based on the most recent Mortgage that was taken out on this home.
Original Mortgage
$120,000
Interest Rate
7.83%
Create a Home Valuation Report for This Property
The Home Valuation Report is an in-depth analysis detailing your home's value as well as a comparison with similar homes in the area
Home Values in the Area
Average Home Value in this Area
Purchase History
| Date | Buyer | Sale Price | Title Company |
|---|---|---|---|
| Sit Kevin Kui Fai | $528,000 | -- | |
| Sit Kevin Kui Fai | $528,000 | -- | |
| Kwong Patrick Tszman | $185,000 | First American Title Ins Co | |
| Kwong Patrick Tszman | $185,000 | First American Title Ins Co |
Source: Public Records
Mortgage History
| Date | Status | Borrower | Loan Amount |
|---|---|---|---|
| Open | Sit Kevin Kui Fai | $200,000 | |
| Closed | Sit Kevin Kui Fai | $200,000 | |
| Previous Owner | Kwong Patrick Tszman | $120,000 |
Source: Public Records
Tax History Compared to Growth
Tax History
| Year | Tax Paid | Tax Assessment Tax Assessment Total Assessment is a certain percentage of the fair market value that is determined by local assessors to be the total taxable value of land and additions on the property. | Land | Improvement |
|---|---|---|---|---|
| 2025 | $7,559 | $41,374 | $11,761 | $29,613 |
| 2024 | $7,571 | $39,035 | $10,723 | $28,312 |
| 2023 | $7,115 | $36,826 | $9,901 | $26,925 |
| 2022 | $7,065 | $52,380 | $15,180 | $37,200 |
| 2021 | $7,305 | $50,280 | $15,180 | $35,100 |
| 2020 | $7,002 | $49,620 | $15,180 | $34,440 |
| 2019 | $6,512 | $47,040 | $15,180 | $31,860 |
| 2018 | $5,958 | $30,688 | $9,621 | $21,067 |
| 2017 | $5,956 | $30,688 | $12,940 | $17,748 |
| 2016 | $5,707 | $30,688 | $12,940 | $17,748 |
| 2015 | $3,272 | $28,732 | $15,556 | $13,176 |
| 2014 | $3,272 | $27,108 | $14,907 | $12,201 |
Source: Public Records
Map
Nearby Homes
- 7027 175th St
- 70-07 171st St
- 67-07 Fresh Meadow Ln
- 71-27 172nd St
- 7126 170th St
- 6737 180th St
- 6532 170th St
- 7164 170th St
- 17508 65th Ave
- 61-40 173rd St
- 75-10 173rd St
- 18108 69th Ave
- 7318 180th St
- 73-15 169th St
- 75-31 175th St
- 168-07 73rd Ave
- 75-82 177 Street 177th St
- 166-03 69th Ave
- 6740 182nd St
- 6547 167th St
- 6936 174th St
- 6940 174th St
- 69-36 174th St
- 6934 174th St
- 6934 174th St
- 6932 174th St
- 6930 174th St
- 6930 174th St
- 17313 Jewel Ave
- 17315 Jewel Ave
- 17311 Jewel Ave
- 17317 Jewel Ave
- 6928 174th St
- 6928 174th St
- 17309 Jewel Ave
- 6937 173rd St
- 173-17 Jewel Ave Unit 2 Fl
- 173-17 Jewel Ave
- 6935 173rd St
- 173-11 Jewel Ave