6938 Laurel Ave Highland, CA 92346
East Highlands NeighborhoodEstimated Value: $527,640 - $553,000
4
Beds
2
Baths
1,365
Sq Ft
$398/Sq Ft
Est. Value
About This Home
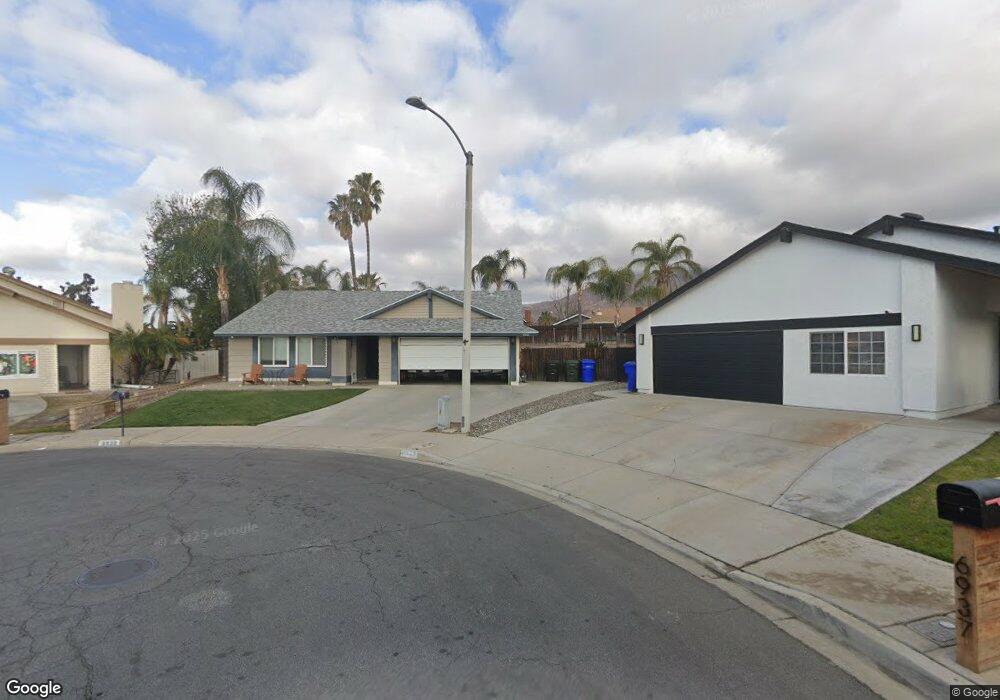
This home is located at 6938 Laurel Ave, Highland, CA 92346 and is currently estimated at $543,910, approximately $398 per square foot. 6938 Laurel Ave is a home located in San Bernardino County with nearby schools including Thompson Elementary School, Serrano Middle School, and San Gorgonio High School.
Ownership History
Date
Name
Owned For
Owner Type
Purchase Details
Closed on
Apr 12, 2002
Sold by
Fortier Jason
Bought by
Barbon Frank W
Current Estimated Value
Home Financials for this Owner
Home Financials are based on the most recent Mortgage that was taken out on this home.
Original Mortgage
$156,700
Interest Rate
6.89%
Purchase Details
Closed on
Jan 25, 1999
Sold by
Ili Giovanni D
Bought by
Fortier Jason and Fortier Lori
Home Financials for this Owner
Home Financials are based on the most recent Mortgage that was taken out on this home.
Original Mortgage
$117,819
Interest Rate
6.7%
Mortgage Type
FHA
Purchase Details
Closed on
Sep 21, 1994
Sold by
Tomaszewski John Edward
Bought by
Ili Giovanni D
Home Financials for this Owner
Home Financials are based on the most recent Mortgage that was taken out on this home.
Original Mortgage
$104,154
Interest Rate
8.78%
Mortgage Type
FHA
Create a Home Valuation Report for This Property
The Home Valuation Report is an in-depth analysis detailing your home's value as well as a comparison with similar homes in the area
Home Values in the Area
Average Home Value in this Area
Purchase History
| Date | Buyer | Sale Price | Title Company |
|---|---|---|---|
| Barbon Frank W | $165,000 | Orange Coast Title | |
| Fortier Jason | $118,000 | American Title | |
| Ili Giovanni D | $106,000 | Chicago Title Co |
Source: Public Records
Mortgage History
| Date | Status | Borrower | Loan Amount |
|---|---|---|---|
| Previous Owner | Barbon Frank W | $156,700 | |
| Previous Owner | Fortier Jason | $117,819 | |
| Previous Owner | Ili Giovanni D | $104,154 |
Source: Public Records
Tax History Compared to Growth
Tax History
| Year | Tax Paid | Tax Assessment Tax Assessment Total Assessment is a certain percentage of the fair market value that is determined by local assessors to be the total taxable value of land and additions on the property. | Land | Improvement |
|---|---|---|---|---|
| 2025 | $3,421 | $243,760 | $60,940 | $182,820 |
| 2024 | $3,421 | $238,980 | $59,745 | $179,235 |
| 2023 | $3,347 | $234,295 | $58,574 | $175,721 |
| 2022 | $3,349 | $229,700 | $57,425 | $172,275 |
| 2021 | $3,315 | $225,196 | $56,299 | $168,897 |
| 2020 | $3,310 | $222,887 | $55,722 | $167,165 |
| 2019 | $3,200 | $218,516 | $54,629 | $163,887 |
| 2018 | $3,098 | $214,232 | $53,558 | $160,674 |
| 2017 | $2,760 | $210,032 | $52,508 | $157,524 |
| 2016 | $2,678 | $205,913 | $51,478 | $154,435 |
| 2015 | $2,728 | $202,820 | $50,705 | $152,115 |
| 2014 | $2,654 | $198,847 | $49,712 | $149,135 |
Source: Public Records
Map
Nearby Homes
- 28037 Clifton St
- 27953 Atlantic Ave
- 6941 La Praix St
- 27875 Rainbow Ln
- 27888 Rainbow Ln
- 27856 Fieldstone Dr
- 7001 Church Ave Unit 5
- 28390 Burns Ave
- 28370 Coachman Ln
- 0 La Praix St
- 6986 Church Ave
- 0 Baseline St Unit CV25136921
- 27471 Main St
- 7440 Apple Blossom Ct
- 3850 Atlantic Ave Unit 58
- 3850 Atlantic Ave Unit 217
- 3850 Atlantic Ave Unit 275
- 3850 Atlantic Ave Unit 296
- 3850 Atlantic Ave Unit 257
- 3850 Atlantic Ave Unit 27
- 6940 Laurel Ave
- 27979 Pacific St
- 27971 Pacific St
- 6937 Laurel Ave
- 27989 Pacific St
- 6948 Laurel Ave
- 27961 Pacific St
- 6927 Mountain Ave
- 6937 Mountain Ave
- 6941 Laurel Ave
- 27999 Pacific St
- 27951 Pacific St
- 6947 Mountain Ave
- 6958 Laurel Ave
- 6949 Laurel Ave
- 28009 Pacific St
- 6959 Laurel Ave
- 6942 Oleander Ave
- 6966 Laurel Ave
- 27982 Pacific St