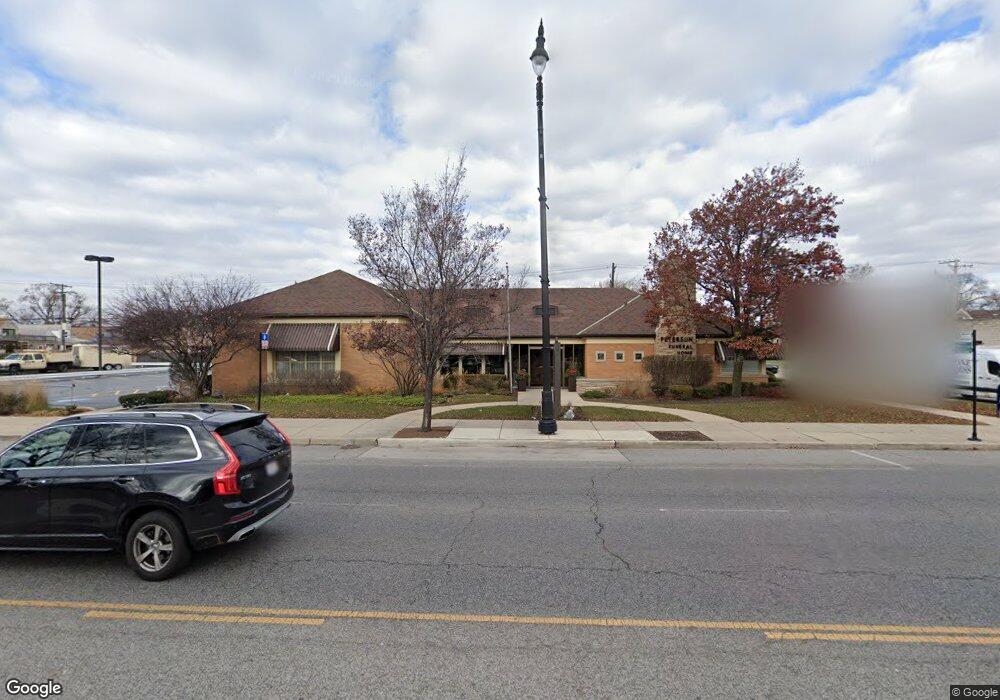
6938 W North Ave Chicago, IL 60707
Galewood NeighborhoodEstimated Value: $580,000 - $737,000
2
Beds
2
Baths
6,527
Sq Ft
$101/Sq Ft
Est. Value
About This Home
This home is located at 6938 W North Ave, Chicago, IL 60707 and is currently estimated at $658,500, approximately $100 per square foot. 6938 W North Ave is a home located in Cook County with nearby schools including Sayre Elementary Language Academy, Steinmetz College Prep, and St Giles School.
Ownership History
Date
Name
Owned For
Owner Type
Purchase Details
Closed on
Jan 27, 2020
Sold by
Bassi Maria P and Bassi Walter G
Bought by
6938 W North Llc
Current Estimated Value
Home Financials for this Owner
Home Financials are based on the most recent Mortgage that was taken out on this home.
Original Mortgage
$775,000
Outstanding Balance
$172,017
Interest Rate
5.25%
Mortgage Type
Commercial
Estimated Equity
$486,483
Purchase Details
Closed on
Nov 5, 2008
Sold by
Peterson Bassi Chapels Llc
Bought by
The Walter G & Maria Pia Bassi Family Tr
Purchase Details
Closed on
Mar 24, 2008
Sold by
Peterson Funeral Home Inc
Bought by
Peterson Bassi Chapels Llc
Home Financials for this Owner
Home Financials are based on the most recent Mortgage that was taken out on this home.
Original Mortgage
$625,000
Interest Rate
5.79%
Mortgage Type
Commercial
Create a Home Valuation Report for This Property
The Home Valuation Report is an in-depth analysis detailing your home's value as well as a comparison with similar homes in the area
Home Values in the Area
Average Home Value in this Area
Purchase History
| Date | Buyer | Sale Price | Title Company |
|---|---|---|---|
| 6938 W North Llc | -- | Greater Illinois Title | |
| The Walter G & Maria Pia Bassi Family Tr | -- | None Available | |
| Peterson Bassi Chapels Llc | $696,000 | None Available |
Source: Public Records
Mortgage History
| Date | Status | Borrower | Loan Amount |
|---|---|---|---|
| Open | 6938 W North Llc | $775,000 | |
| Previous Owner | Peterson Bassi Chapels Llc | $625,000 |
Source: Public Records
Tax History Compared to Growth
Tax History
| Year | Tax Paid | Tax Assessment Tax Assessment Total Assessment is a certain percentage of the fair market value that is determined by local assessors to be the total taxable value of land and additions on the property. | Land | Improvement |
|---|---|---|---|---|
| 2024 | $8,652 | $84,000 | $42,492 | $41,508 |
| 2023 | $8,434 | $41,000 | $20,874 | $20,126 |
| 2022 | $8,434 | $41,000 | $20,874 | $20,126 |
| 2021 | $8,246 | $41,005 | $20,880 | $20,125 |
| 2020 | $11,021 | $49,474 | $32,666 | $16,808 |
| 2019 | $11,425 | $56,867 | $32,666 | $24,201 |
| 2018 | $11,233 | $56,867 | $32,666 | $24,201 |
| 2017 | $11,722 | $54,454 | $28,746 | $25,708 |
| 2016 | $10,906 | $54,454 | $28,746 | $25,708 |
| 2015 | $9,978 | $54,454 | $28,746 | $25,708 |
| 2014 | $9,964 | $53,703 | $26,133 | $27,570 |
Source: Public Records
Map
Nearby Homes
- 1600 N New England Ave Unit 4
- 1701 N Newland Ave
- 1709 N Newland Ave
- 1143 Woodbine Ave
- 1733 N Oak Park Ave
- 1639 N Normandy Ave
- 1037 Belleforte Ave
- 1411 N Harlem Ave Unit A
- 1905 N Nordica Ave
- 1700 N Natoma Ave
- 1009 N Oak Park Ave
- 1407 N Harlem Ave Unit C
- 1227 N East Ave
- 7234 W North Ave Unit 1214
- 7234 W North Ave Unit 1902
- 7234 W North Ave Unit 1701
- 7234 W North Ave Unit 1602
- 7234 W North Ave Unit 701
- 7234 W North Ave Unit 711
- 7234 W North Ave Unit 1008
- 6946 W North Ave
- 6942 W North Ave
- 6940 W North Ave
- 6950 W North Ave
- 6948 W North Ave
- 6934 W North Ave
- 1614 N Newland Ave
- 6954 W North Ave
- 1618 N Newland Ave
- 1620 N Newland Ave
- 6960 W North Ave Unit 3
- 6960 W North Ave
- 1624 N Newland Ave
- 6966 W North Ave
- 6972 W North Ave
- 1628 N Newland Ave
- 6970 W North Ave Unit 1
- 1630 N Newland Ave
- 1619 N Sayre Ave
- 6920 W North Ave