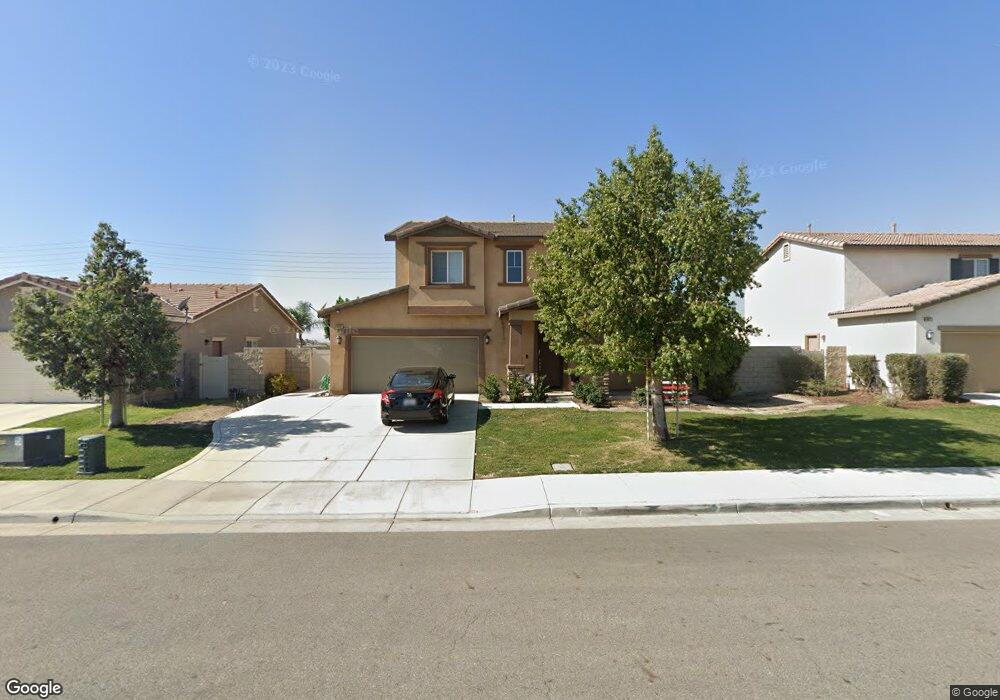
6939 Woodrush Way Eastvale, CA 92880
Estimated Value: $836,136 - $913,000
3
Beds
3
Baths
2,248
Sq Ft
$396/Sq Ft
Est. Value
About This Home
This home is located at 6939 Woodrush Way, Eastvale, CA 92880 and is currently estimated at $889,534, approximately $395 per square foot. 6939 Woodrush Way is a home with nearby schools including Rosa Parks Elementary School, Dr. Augustine Ramirez Intermediate School, and Eleanor Roosevelt High School.
Ownership History
Date
Name
Owned For
Owner Type
Purchase Details
Closed on
Feb 26, 2024
Sold by
Barrios Michael Joseph and Barrios Richelle
Bought by
Barrios Trust and Barrios
Current Estimated Value
Purchase Details
Closed on
Apr 18, 2014
Sold by
Barrios Michael and Barrios Richelle
Bought by
Barrios Michael and Barrios Richelle
Home Financials for this Owner
Home Financials are based on the most recent Mortgage that was taken out on this home.
Original Mortgage
$25,000
Interest Rate
4.32%
Mortgage Type
New Conventional
Purchase Details
Closed on
Aug 22, 2011
Sold by
D R Horton Los Angeles Holding Company I
Bought by
Barrios Michael and Barrios Richele
Home Financials for this Owner
Home Financials are based on the most recent Mortgage that was taken out on this home.
Original Mortgage
$333,440
Interest Rate
4.26%
Mortgage Type
New Conventional
Create a Home Valuation Report for This Property
The Home Valuation Report is an in-depth analysis detailing your home's value as well as a comparison with similar homes in the area
Home Values in the Area
Average Home Value in this Area
Purchase History
| Date | Buyer | Sale Price | Title Company |
|---|---|---|---|
| Barrios Trust | -- | None Listed On Document | |
| Barrios Michael Joseph | -- | None Listed On Document | |
| Barrios Michael | -- | Chicago Title Company | |
| Barrios Michael | $351,000 | Lawyers Title |
Source: Public Records
Mortgage History
| Date | Status | Borrower | Loan Amount |
|---|---|---|---|
| Previous Owner | Barrios Michael | $25,000 | |
| Previous Owner | Barrios Michael | $333,440 |
Source: Public Records
Tax History Compared to Growth
Tax History
| Year | Tax Paid | Tax Assessment Tax Assessment Total Assessment is a certain percentage of the fair market value that is determined by local assessors to be the total taxable value of land and additions on the property. | Land | Improvement |
|---|---|---|---|---|
| 2025 | $7,274 | $448,017 | $138,156 | $309,861 |
| 2023 | $7,274 | $430,623 | $132,793 | $297,830 |
| 2022 | $7,082 | $422,181 | $130,190 | $291,991 |
| 2021 | $6,885 | $413,904 | $127,638 | $286,266 |
| 2020 | $6,806 | $409,661 | $126,330 | $283,331 |
| 2019 | $6,784 | $401,629 | $123,853 | $277,776 |
| 2018 | $6,679 | $393,755 | $121,426 | $272,329 |
| 2017 | $6,522 | $386,036 | $119,046 | $266,990 |
| 2016 | $6,425 | $378,467 | $116,712 | $261,755 |
| 2015 | $6,291 | $372,784 | $114,960 | $257,824 |
| 2014 | $6,170 | $365,484 | $112,709 | $252,775 |
Source: Public Records
Map
Nearby Homes
- 8756 Festival St
- 8704 Celebration St
- 16116 Huckleberry Ave
- 16070 Huckleberry Ave
- 15993 Huckleberry Ave
- 8787 Wanderlin Place
- 16136 Huckleberry Ave
- 16004 Huckleberry Ave
- 16119 Alamo Ct
- Plan 2046 Modeled at Rembrandt at Contour
- Plan 2100 at Rembrandt at Contour
- Plan 1815 at Rembrandt at Contour
- Plan 1900 Modeled at Rembrandt at Contour
- 16121 Alamo Ct
- 8706 Founders Grove St
- 16009 Alamo Ct
- 16037 Alamo Ct
- 16413 Globetrotter Ave
- 15999 Alamo Ct
- 16019 Alamo Ct
- 6927 Woodrush Way
- 6963 Woodrush Way
- 6936 Woodrush Way
- 6948 Woodrush Way
- 6924 Woodrush Way
- 6960 Woodrush Way
- 6891 Woodrush Way
- 16105 Almond Ave
- 16099 Almond Ave
- 16109 Almond Ave
- 6975 Woodrush Way
- 16091 Almond Ave
- 16085 Almond Ave
- 14965 Landerwood Dr
- 14999 Murwood Ln
- 14954 Murwood Ln
- 14980 Landerwood Dr
- 16125 Almond Ave
- 16077 Almond Ave
- 14987 Murwood Ln