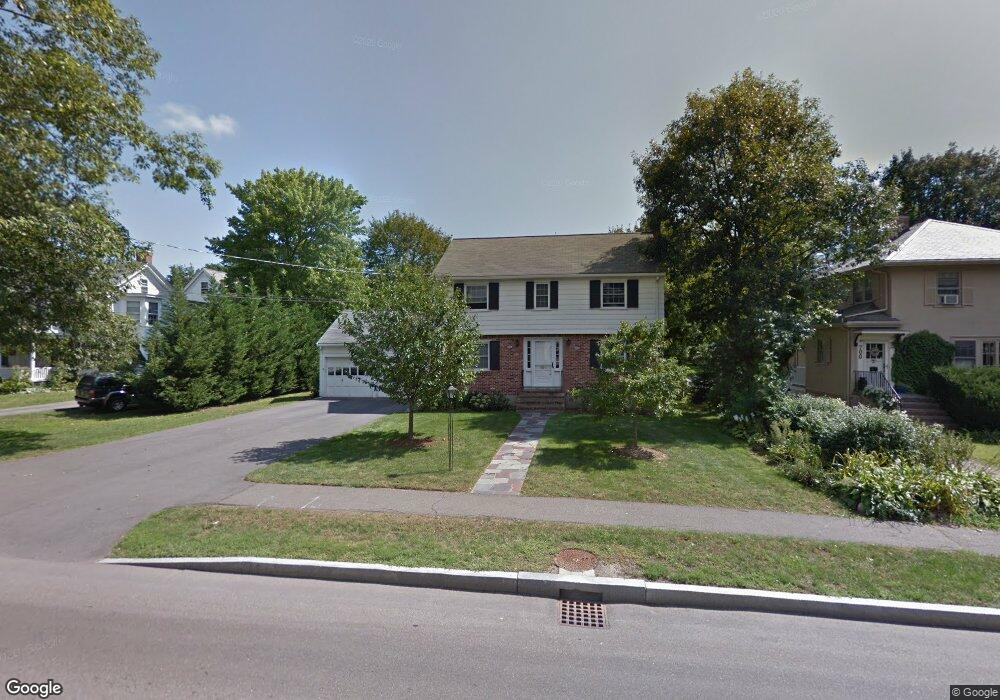
694 Webster St Needham, MA 02492
Needham AreaEstimated Value: $1,398,000 - $1,710,543
About This Home
This home is located at 694 Webster St, Needham, MA 02492 and is currently estimated at $1,557,386, approximately $1,649 per square foot. 694 Webster St is a home located in Norfolk County with nearby schools including Mitchell Elementary School, High Rock Middle School, and Pollard Middle School.
Ownership History
We collect this data history from publicly available records. To have your information removed, we recommend requesting removal directly through your county’s website.
Purchase Details
Purchase Details
Home Values in the Area
Average Home Value in this Area
Purchase History
We collect this data history from publicly available records. To have your information removed, we recommend requesting removal directly through your county’s website.
| Date | Buyer | Sale Price | Title Company |
|---|---|---|---|
| -- | None Available | ||
| $269,000 | -- |
Tax History
We collect this data history from publicly available records. To have your information removed, we recommend requesting removal directly through your county’s website.
| Year | Tax Paid | Tax Assessment Tax Assessment Total Assessment is a certain percentage of the fair market value that is determined by local assessors to be the total taxable value of land and additions on the property. | Land | Improvement |
|---|---|---|---|---|
| 2025 | $13,504 | $1,274,000 | $913,900 | $360,100 |
| 2024 | $11,570 | $924,100 | $590,500 | $333,600 |
| 2023 | $11,669 | $894,900 | $590,500 | $304,400 |
| 2022 | $11,200 | $837,700 | $542,600 | $295,100 |
| 2021 | $10,915 | $837,700 | $542,600 | $295,100 |
| 2020 | $10,407 | $833,200 | $542,600 | $290,600 |
| 2019 | $9,685 | $781,700 | $494,200 | $287,500 |
| 2018 | $9,287 | $781,700 | $494,200 | $287,500 |
| 2017 | $8,856 | $744,800 | $494,200 | $250,600 |
| 2016 | $8,595 | $744,800 | $494,200 | $250,600 |
| 2015 | $8,409 | $744,800 | $494,200 | $250,600 |
| 2014 | $8,048 | $691,400 | $446,800 | $244,600 |
Map
- 246 Manning St
- 279 Brookline St Unit 279
- 89 Melrose Ave
- 89 May St Unit 4
- 9 Morley St
- 277 Brookline St
- 19 Oakland Ave Unit 19
- 131 Fair Oaks Park
- 11 Mayo Ave
- 78 Sargent St
- 24 Cleveland Rd
- 15 Hawthorn Ave
- 26 Hawthorn Ave
- 42 Hawthorn Ave
- 54 Hawthorn Ave
- 18 Grant St Unit Rear
- 61 Pleasant St
- 100 Rosemary Way Unit 322
- 46 Howland St Unit 46
- 170 West St Unit 170
- 700 Webster St
- 686 Webster St
- 706 Webster St
- 689 Webster St
- 119 Powers St
- 710 Webster St
- 710 Webster St Unit 710
- 710 Webster St Unit 2
- 674 Webster St Unit 1
- 674 Webster St
- 113 Powers St
- 695 Webster St
- 295 Manning St
- 10 Kingsbury St
- 701 Webster St
- 299 Manning St
- 109 Powers St
- 285 Manning St
- 673 Webster St
- 126 Powers St
Ask me questions while you tour the home.