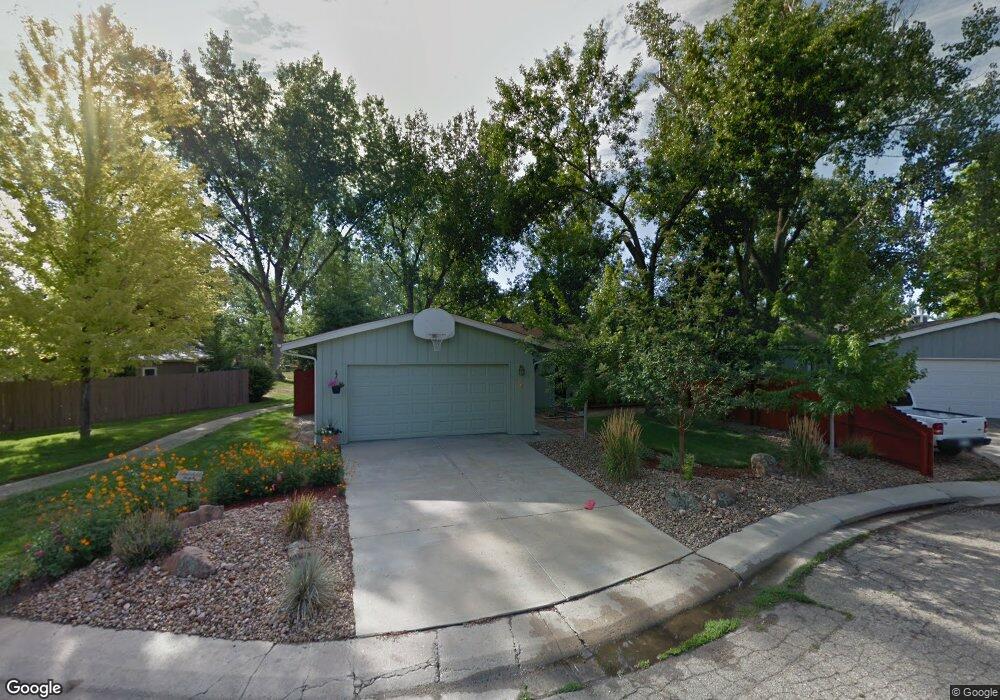
6940 Niwot Square Niwot, CO 80503
Niwot NeighborhoodEstimated Value: $672,529 - $884,000
3
Beds
2
Baths
1,087
Sq Ft
$696/Sq Ft
Est. Value
About This Home
This home is located at 6940 Niwot Square, Niwot, CO 80503 and is currently estimated at $756,632, approximately $696 per square foot. 6940 Niwot Square is a home located in Boulder County with nearby schools including Niwot Elementary School, Sunset Middle School, and Niwot High School.
Ownership History
Date
Name
Owned For
Owner Type
Purchase Details
Closed on
Jun 19, 1998
Sold by
Charles Robert F
Bought by
Connelly Kevin A and Connelly Kathy M
Current Estimated Value
Home Financials for this Owner
Home Financials are based on the most recent Mortgage that was taken out on this home.
Original Mortgage
$93,750
Outstanding Balance
$18,951
Interest Rate
7.17%
Estimated Equity
$737,681
Purchase Details
Closed on
Nov 4, 1997
Sold by
Charles Dale M
Bought by
Charles Robert F
Purchase Details
Closed on
Oct 4, 1989
Bought by
Connelly Kevin A and Connelly Kathy M
Purchase Details
Closed on
Nov 21, 1988
Bought by
Connelly Kevin A and Connelly Kathy M
Create a Home Valuation Report for This Property
The Home Valuation Report is an in-depth analysis detailing your home's value as well as a comparison with similar homes in the area
Home Values in the Area
Average Home Value in this Area
Purchase History
| Date | Buyer | Sale Price | Title Company |
|---|---|---|---|
| Connelly Kevin A | $169,750 | -- | |
| Charles Robert F | $170,000 | -- | |
| Connelly Kevin A | $87,000 | -- | |
| Connelly Kevin A | $92,000 | -- |
Source: Public Records
Mortgage History
| Date | Status | Borrower | Loan Amount |
|---|---|---|---|
| Open | Connelly Kevin A | $93,750 |
Source: Public Records
Tax History Compared to Growth
Tax History
| Year | Tax Paid | Tax Assessment Tax Assessment Total Assessment is a certain percentage of the fair market value that is determined by local assessors to be the total taxable value of land and additions on the property. | Land | Improvement |
|---|---|---|---|---|
| 2025 | $3,899 | $40,063 | $13,688 | $26,375 |
| 2024 | $3,899 | $40,063 | $13,688 | $26,375 |
| 2023 | $3,848 | $39,255 | $12,656 | $30,284 |
| 2022 | $3,278 | $31,886 | $11,363 | $20,523 |
| 2021 | $3,322 | $32,804 | $11,690 | $21,114 |
| 2020 | $3,114 | $30,817 | $4,719 | $26,098 |
| 2019 | $3,063 | $30,817 | $4,719 | $26,098 |
| 2018 | $2,555 | $25,819 | $4,392 | $21,427 |
| 2017 | $2,406 | $28,545 | $4,856 | $23,689 |
| 2016 | $2,382 | $25,034 | $5,015 | $20,019 |
| 2015 | $2,269 | $21,660 | $5,652 | $16,008 |
| 2014 | $2,222 | $21,660 | $5,652 | $16,008 |
Source: Public Records
Map
Nearby Homes
- 8050 Niwot Rd Unit 1
- 8050 Niwot Rd Unit 28
- 8050 Niwot Rd Unit 40
- 8060 Niwot Rd Unit 66E
- 8060 Niwot Rd Unit 34
- 8076 Meadowdale Square
- 8180 Dry Creek Cir
- 7464 Whirlaway Ln
- 7284 Dry Creek Rd
- 8400 Sawtooth Ln
- 8461 Pawnee Ln
- 3625 Nimbus Rd
- 8748 Skyland Dr
- 7204 Spring Creek Cir
- 6789 Niwot Rd
- 8896 Niwot Rd
- 8020 N 81st St
- 7466 Park Lane Rd
- 6541 Legend Ridge Trail
- 6557 Legend Ridge Trail
- 6930 Niwot Square
- 6930 Niwot Square Dr
- 6963 Totara Place
- 6957 Totara Place
- 6920 Niwot Square
- 6955 Niwot Square
- 7614 Nikau Dr
- 6953 Totara Place
- 7592 Nikau Dr
- 6910 Niwot Square
- 7624 Nikau Dr
- 6949 Conifer Ct
- 7634 Nikau Dr
- 6960 Niwot Square
- 6947 Totara Place
- 7582 Nikau Dr
- 7808 Nikau Dr
- 6967 Miro Ct
- 6943 Totara Place
- 6945 Conifer Ct