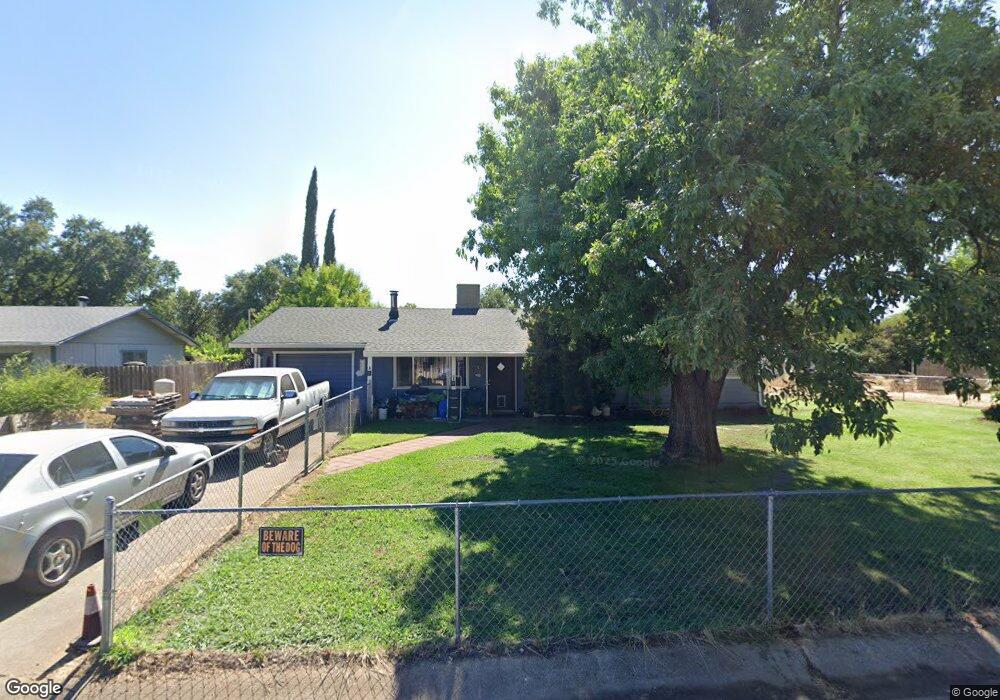
6940 Weeks Rd Redding, CA 96002
Estimated Value: $282,000 - $333,000
Studio
2
Baths
1,150
Sq Ft
$261/Sq Ft
Est. Value
About This Home
This home is located at 6940 Weeks Rd, Redding, CA 96002 and is currently estimated at $299,956, approximately $260 per square foot. 6940 Weeks Rd is a home located in Shasta County with nearby schools including Prairie Elementary School, Pacheco Elementary School, and Northern Summit Academy.
Ownership History
Date
Name
Owned For
Owner Type
Purchase Details
Closed on
Apr 17, 2002
Sold by
Maplesden Brad
Bought by
Maplesden Brad
Current Estimated Value
Home Financials for this Owner
Home Financials are based on the most recent Mortgage that was taken out on this home.
Original Mortgage
$80,347
Outstanding Balance
$33,949
Interest Rate
7.08%
Mortgage Type
FHA
Estimated Equity
$266,007
Purchase Details
Closed on
Jun 9, 2000
Sold by
Maplesden Cynthia L
Bought by
Maplesden Brad
Purchase Details
Closed on
Jul 13, 1999
Sold by
Hud
Bought by
Maplesden Brad and Maplesden Cynthia L
Home Financials for this Owner
Home Financials are based on the most recent Mortgage that was taken out on this home.
Original Mortgage
$81,442
Interest Rate
7.4%
Mortgage Type
FHA
Purchase Details
Closed on
Feb 8, 1999
Sold by
Guild Mtg Company
Bought by
Hud
Purchase Details
Closed on
Nov 24, 1998
Sold by
Black Stephen R and Black Jodi M
Bought by
Guild Mtg Company
Create a Home Valuation Report for This Property
The Home Valuation Report is an in-depth analysis detailing your home's value as well as a comparison with similar homes in the area
Purchase History
| Date | Buyer | Sale Price | Title Company |
|---|---|---|---|
| Maplesden Brad | -- | Fidelity National Title Co | |
| Maplesden Brad | -- | -- | |
| Maplesden Brad | $82,500 | Placer Title Company | |
| Hud | -- | Fidelity National Title | |
| Guild Mtg Company | $80,085 | Fidelity National Title |
Source: Public Records
Mortgage History
| Date | Status | Borrower | Loan Amount |
|---|---|---|---|
| Open | Maplesden Brad | $80,347 | |
| Closed | Maplesden Brad | $81,442 |
Source: Public Records
Tax History
| Year | Tax Paid | Tax Assessment Tax Assessment Total Assessment is a certain percentage of the fair market value that is determined by local assessors to be the total taxable value of land and additions on the property. | Land | Improvement |
|---|---|---|---|---|
| 2025 | $1,354 | $126,007 | $30,727 | $95,280 |
| 2024 | $1,326 | $123,537 | $30,125 | $93,412 |
| 2023 | $1,326 | $121,116 | $29,535 | $91,581 |
| 2022 | $1,293 | $118,742 | $28,956 | $89,786 |
| 2021 | $1,272 | $116,415 | $28,389 | $88,026 |
| 2020 | $1,257 | $115,222 | $28,098 | $87,124 |
| 2019 | $1,241 | $112,964 | $27,548 | $85,416 |
| 2018 | $1,192 | $110,750 | $27,008 | $83,742 |
| 2017 | $1,209 | $108,579 | $26,479 | $82,100 |
| 2016 | $1,144 | $106,451 | $25,960 | $80,491 |
| 2015 | $1,142 | $104,853 | $25,571 | $79,282 |
| 2014 | $1,129 | $102,800 | $25,071 | $77,729 |
Source: Public Records
Map
Nearby Homes
- 6870 Riverland Dr
- 6950 Riverland Dr Unit 23
- 6950 Riverland Dr Unit 27
- 7100 Milky Way
- 0 Milky Way
- 7067 Tucker Ln
- 6927 Riata Dr
- 19301 Clover Rd
- 7408 Bridge Ln
- 7587 Fiesta Way
- 6639 Riata Dr
- 7155 The Terrace St
- 0 Villa Ct
- 7520 Lockheed Dr
- 7530 Lockheed Dr
- 7100 Amigo Way
- 6820 California 273
- 7213 Amigo Way
- 20260 River Valley Dr
- 7235 Amigo Way
Your Personal Tour Guide
Ask me questions while you tour the home.