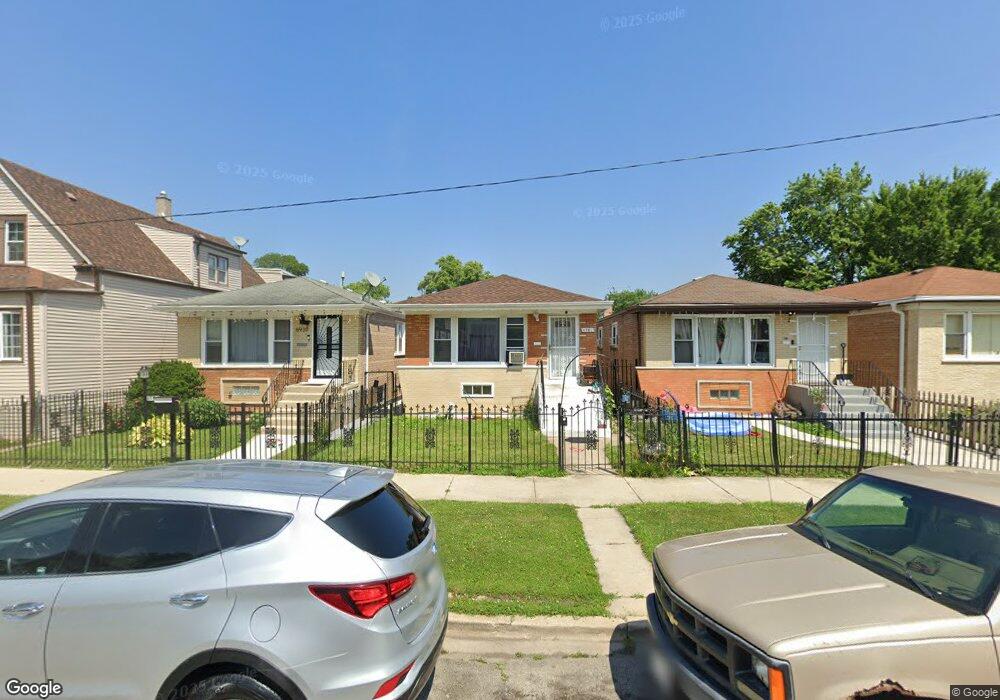
6941 S Winchester Ave Chicago, IL 60636
Englewood NeighborhoodEstimated Value: $164,000 - $224,000
3
Beds
1
Bath
1,040
Sq Ft
$183/Sq Ft
Est. Value
About This Home
This home is located at 6941 S Winchester Ave, Chicago, IL 60636 and is currently estimated at $190,272, approximately $182 per square foot. 6941 S Winchester Ave is a home located in Cook County with nearby schools including Randolph Elementary School, The Montessori School of Englewood Charter School, and Providence-Englewood Elementary Charter School.
Create a Home Valuation Report for This Property
The Home Valuation Report is an in-depth analysis detailing your home's value as well as a comparison with similar homes in the area
Home Values in the Area
Average Home Value in this Area
Tax History Compared to Growth
Tax History
| Year | Tax Paid | Tax Assessment Tax Assessment Total Assessment is a certain percentage of the fair market value that is determined by local assessors to be the total taxable value of land and additions on the property. | Land | Improvement |
|---|---|---|---|---|
| 2024 | $112 | $11,001 | $938 | $10,063 |
| 2023 | $70 | $6,500 | $2,031 | $4,469 |
| 2022 | $70 | $6,500 | $2,031 | $4,469 |
| 2021 | $101 | $6,499 | $2,031 | $4,468 |
| 2020 | $143 | $6,228 | $2,031 | $4,197 |
| 2019 | $150 | $6,920 | $2,031 | $4,889 |
| 2018 | $145 | $6,920 | $2,031 | $4,889 |
| 2017 | $1,967 | $9,138 | $1,875 | $7,263 |
| 2016 | $973 | $9,138 | $1,875 | $7,263 |
| 2015 | $850 | $9,138 | $1,875 | $7,263 |
| 2014 | $1,109 | $8,548 | $1,718 | $6,830 |
| 2013 | $1,076 | $8,548 | $1,718 | $6,830 |
Source: Public Records
Map
Nearby Homes
- 7024 S Honore St
- 2008 W 69th Place
- 6830 S Honore St
- 6825 S Winchester Ave
- 7031 S Damen Ave
- 2020 W 69th Place
- 7049 S Damen Ave
- 7056 S Honore St
- 7015 S Wood St
- 1851 W 71st St
- 2044 W 69th St
- 1809 W 71st St
- 6805 S Wood St
- 7017 S Hermitage Ave
- 6812 S Hermitage Ave
- 2101 W 69th St
- 7002 S Paulina St
- 7139 S Winchester Ave
- 7010 S Paulina St
- 7133 S Honore St
- 6939 S Winchester Ave
- 6943 S Winchester Ave
- 6947 S Winchester Ave
- 6935 S Winchester Ave
- 6949 S Winchester Ave
- 6933 S Winchester Ave
- 6953 S Winchester Ave
- 6929 S Winchester Ave
- 6940 S Wolcott Ave
- 6940 S Wolcott Ave
- 6942 S Wolcott Ave
- 6955 S Winchester Ave
- 6946 S Wolcott Ave
- 6925 S Winchester Ave
- 6925 S Winchester Ave
- 6932 S Wolcott Ave
- 6940 S Winchester Ave
- 6936 S Wolcott Ave
- 6930 S Wolcott Ave
- 6950 S Wolcott Ave