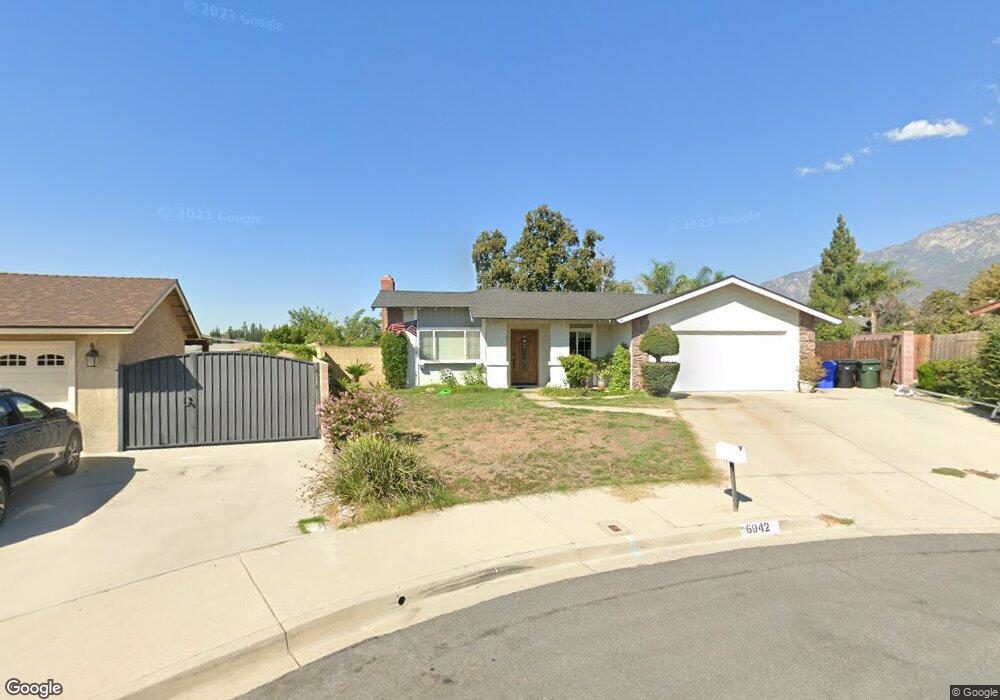
6942 Teak Way Rancho Cucamonga, CA 91701
Estimated Value: $765,000 - $799,000
3
Beds
2
Baths
1,612
Sq Ft
$485/Sq Ft
Est. Value
About This Home
This home is located at 6942 Teak Way, Rancho Cucamonga, CA 91701 and is currently estimated at $782,085, approximately $485 per square foot. 6942 Teak Way is a home located in San Bernardino County with nearby schools including Deer Canyon Elementary, Vineyard Junior High, and Los Osos High.
Ownership History
Date
Name
Owned For
Owner Type
Purchase Details
Closed on
Mar 12, 2008
Sold by
Liv Nuckolls Debra K
Bought by
Nuckolls Debra K
Current Estimated Value
Home Financials for this Owner
Home Financials are based on the most recent Mortgage that was taken out on this home.
Original Mortgage
$272,000
Interest Rate
5.65%
Mortgage Type
New Conventional
Purchase Details
Closed on
Mar 22, 1999
Sold by
Nuckolls Debra K
Bought by
Nuckolls Debra K and The Debra K Nuckolls Revocable
Purchase Details
Closed on
Dec 3, 1998
Sold by
Nuckolls John L and Nuckolls Debra K
Bought by
Nuckolls Debra K
Home Financials for this Owner
Home Financials are based on the most recent Mortgage that was taken out on this home.
Original Mortgage
$110,200
Interest Rate
6.63%
Purchase Details
Closed on
Jan 23, 1996
Sold by
Nuckolls John L
Bought by
Nuckolls Debra K and Nuckolls John L
Create a Home Valuation Report for This Property
The Home Valuation Report is an in-depth analysis detailing your home's value as well as a comparison with similar homes in the area
Home Values in the Area
Average Home Value in this Area
Purchase History
| Date | Buyer | Sale Price | Title Company |
|---|---|---|---|
| Nuckolls Debra K | -- | Orange Coast Title | |
| Nuckolls Debra K | -- | -- | |
| Nuckolls Debra K | -- | Commonwealth Land Title Co | |
| Nuckolls Debra K | -- | -- |
Source: Public Records
Mortgage History
| Date | Status | Borrower | Loan Amount |
|---|---|---|---|
| Closed | Nuckolls Debra K | $272,000 | |
| Closed | Nuckolls Debra K | $110,200 |
Source: Public Records
Tax History Compared to Growth
Tax History
| Year | Tax Paid | Tax Assessment Tax Assessment Total Assessment is a certain percentage of the fair market value that is determined by local assessors to be the total taxable value of land and additions on the property. | Land | Improvement |
|---|---|---|---|---|
| 2025 | $1,702 | $160,753 | $26,645 | $134,108 |
| 2024 | $1,702 | $157,601 | $26,123 | $131,478 |
| 2023 | $1,662 | $154,511 | $25,611 | $128,900 |
| 2022 | $1,656 | $151,482 | $25,109 | $126,373 |
| 2021 | $1,654 | $148,512 | $24,617 | $123,895 |
| 2020 | $1,587 | $146,990 | $24,365 | $122,625 |
| 2019 | $1,603 | $144,108 | $23,887 | $120,221 |
| 2018 | $1,566 | $141,283 | $23,419 | $117,864 |
| 2017 | $1,494 | $138,513 | $22,960 | $115,553 |
| 2016 | $1,453 | $135,797 | $22,510 | $113,287 |
| 2015 | $1,443 | $133,757 | $22,172 | $111,585 |
| 2014 | $1,401 | $131,137 | $21,738 | $109,399 |
Source: Public Records
Map
Nearby Homes
- 10040 Jonquil Dr
- 6949 Laguna Place Unit B1
- 7018 Princeton Place
- 6740 London Ave
- 9740 Woodleaf Dr
- 9800 Baseline Rd Unit 76
- 9800 Baseline Rd Unit 71
- 9800 Baseline Rd Unit 17
- 9800 Baseline Rd Unit 82
- 9800 Baseline Rd Unit 62
- 6946 Archibald Ave
- 10210 Baseline Rd Unit 30
- 10210 Baseline Rd Unit 62
- 10210 Baseline Rd Unit 115
- 10210 Baseline Rd Unit 289
- 6880 Archibald Ave Unit 27
- 6880 Archibald Ave Unit 40
- 6880 Archibald Ave Unit 43
- 6765 Jadeite Ave
- 6644 Brissac Place
- 6938 Teak Way
- 6952 Teak Way
- 6941 Berkshire Ave
- 6931 Berkshire Ave
- 6951 Berkshire Ave
- 9977 Victoria St
- 9967 Victoria St
- 6962 Teak Way
- 6939 Teak Way
- 9987 Victoria St
- 9957 Victoria St
- 6943 Teak Way
- 6953 Teak Way
- 9997 Victoria St
- 6963 Teak Way
- 9980 Monte Vista St
- 9970 Monte Vista St
- 10005 Victoria St
- 9958 Monte Vista St
- 6934 Berkshire Ave