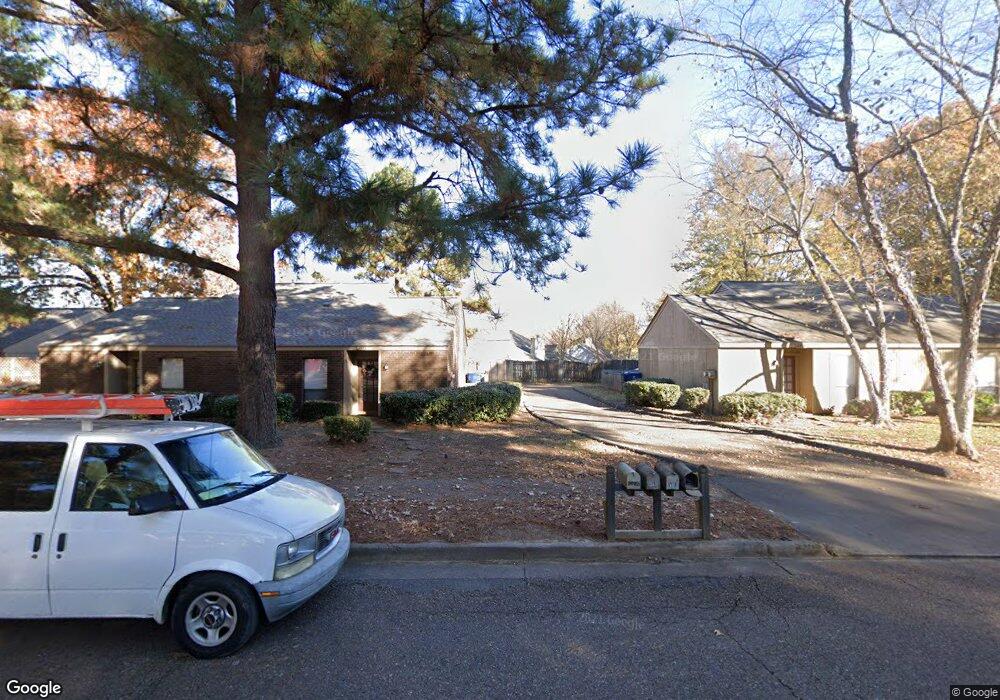
6947 Lagrange Cir S Cordova, TN 38018
Cordova NeighborhoodEstimated Value: $207,910 - $221,000
3
Beds
2
Baths
1,399
Sq Ft
$152/Sq Ft
Est. Value
About This Home
This home is located at 6947 Lagrange Cir S, Cordova, TN 38018 and is currently estimated at $212,978, approximately $152 per square foot. 6947 Lagrange Cir S is a home located in Shelby County with nearby schools including Dexter Elementary School, Dexter Middle School, and Cordova High School.
Ownership History
Date
Name
Owned For
Owner Type
Purchase Details
Closed on
Dec 20, 2024
Sold by
Larson Lars and Larson Leilani
Bought by
Filtered Sunlight Llc-6947 Lagrange Cir S Pro
Current Estimated Value
Purchase Details
Closed on
Sep 30, 2005
Sold by
Switzer Daniel S and Switzer Candace L
Bought by
Larson Lars and Larson Leilani
Home Financials for this Owner
Home Financials are based on the most recent Mortgage that was taken out on this home.
Original Mortgage
$89,520
Interest Rate
5.66%
Mortgage Type
Fannie Mae Freddie Mac
Purchase Details
Closed on
Nov 30, 1998
Sold by
Dooley Robert C and Dooley Virgina R
Bought by
Switzer Daniel S and Switzer Candace L
Home Financials for this Owner
Home Financials are based on the most recent Mortgage that was taken out on this home.
Original Mortgage
$106,296
Interest Rate
6.77%
Mortgage Type
FHA
Create a Home Valuation Report for This Property
The Home Valuation Report is an in-depth analysis detailing your home's value as well as a comparison with similar homes in the area
Home Values in the Area
Average Home Value in this Area
Purchase History
| Date | Buyer | Sale Price | Title Company |
|---|---|---|---|
| Filtered Sunlight Llc-6947 Lagrange Cir S Pro | -- | None Listed On Document | |
| Larson Lars | $111,900 | Fidelity Title & Escrow Inc | |
| Switzer Daniel S | $105,900 | -- | |
| Switzer Daniel S | $105,900 | -- |
Source: Public Records
Mortgage History
| Date | Status | Borrower | Loan Amount |
|---|---|---|---|
| Previous Owner | Larson Lars | $89,520 | |
| Previous Owner | Switzer Daniel S | $106,296 |
Source: Public Records
Tax History Compared to Growth
Tax History
| Year | Tax Paid | Tax Assessment Tax Assessment Total Assessment is a certain percentage of the fair market value that is determined by local assessors to be the total taxable value of land and additions on the property. | Land | Improvement |
|---|---|---|---|---|
| 2025 | $1,211 | $50,300 | $6,500 | $43,800 |
| 2024 | $1,211 | $35,725 | $5,325 | $30,400 |
| 2023 | $1,211 | $35,725 | $5,325 | $30,400 |
| 2022 | $1,211 | $35,725 | $5,325 | $30,400 |
| 2021 | $1,233 | $35,725 | $5,325 | $30,400 |
| 2020 | $1,055 | $26,050 | $5,325 | $20,725 |
| 2019 | $1,055 | $26,050 | $5,325 | $20,725 |
| 2018 | $1,055 | $26,050 | $5,325 | $20,725 |
| 2017 | $1,071 | $26,050 | $5,325 | $20,725 |
| 2016 | $1,053 | $24,100 | $0 | $0 |
| 2014 | $1,053 | $24,100 | $0 | $0 |
Source: Public Records
Map
Nearby Homes
- 1382 Exbury Dr
- 6916 Lagrange Pines Rd
- 7035 S Estacada Way
- 6838 Lagrange Cir N
- 6774 Whitten Pine Dr
- 6884 Wrigley Dr
- 6880 Wrigley Dr
- 7194 Charlton Way
- 6890 Century Oaks Dr
- 7412 Lost Trail Dr
- 7407 Lost Grove Ln
- 7410 Appling Rain Dr
- 7426 Lost Trail Dr
- 6452 Macon Rd
- 7520 Crystal Lake Dr
- 1321 Winter Springs Ln
- 1089 Links View Ln W
- 1520 Cider House Ln
- 1595 Dexter Grove Ct Unit E105
- 1595 Dexter Grove Ct Unit D101
- 6951 Lagrange Cir S
- 6943 Lagrange Cir S
- 6955 Lagrange Cir S
- 6939 Lagrange Cir S
- 6969 Lagrange Hill Rd
- 6973 Lagrange Hill Rd
- 6935 Lagrange Cir S
- 6963 Lagrange Hill Rd
- 6950 Lagrange Cir S
- 6977 Lagrange Hill Rd
- 6934 Lagrange Cir S
- 6929 Lagrange Cir S
- 6981 Lagrange Hill Rd
- 6928 Lagrange Cir S
- 6977 Amberly Village Dr Tt-44291-2
- 6923 Lagrange Cir S
- 6977 Amberly Village Dr
- 6977 Amberly Village Dr
- 6977 Amberly Village Dr
- 6937 Lagrange Hill Rd