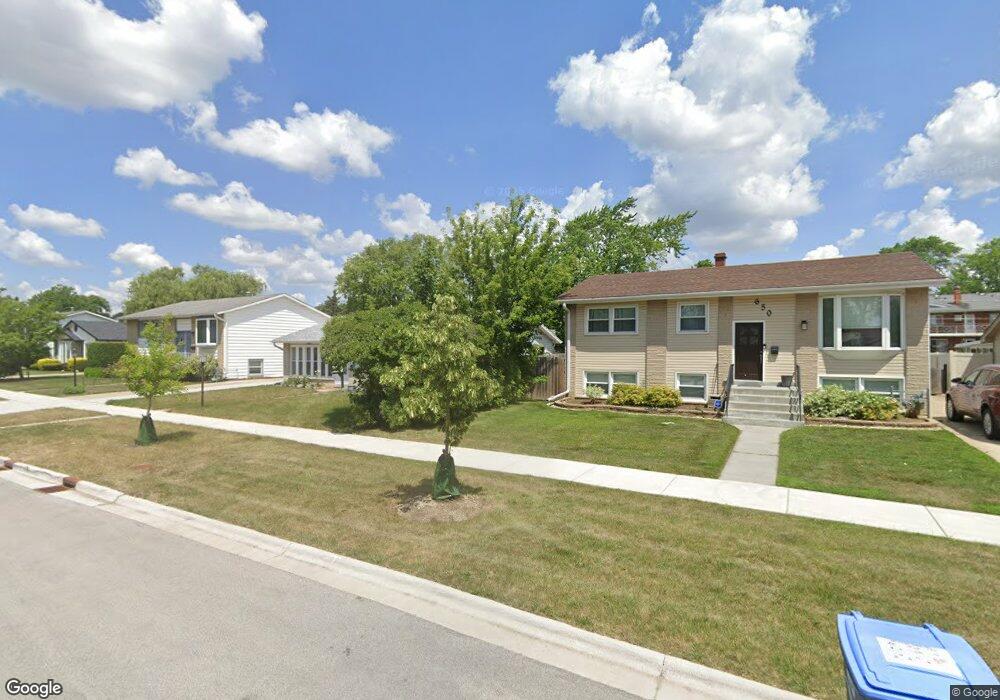
695 Dulles Rd Des Plaines, IL 60016
Estimated Value: $198,000 - $239,350
2
Beds
1
Bath
889
Sq Ft
$251/Sq Ft
Est. Value
About This Home
This home is located at 695 Dulles Rd, Des Plaines, IL 60016 and is currently estimated at $223,338, approximately $251 per square foot. 695 Dulles Rd is a home located in Cook County with nearby schools including Brentwood Elementary School, Friendship Jr High School, and Elk Grove High School.
Ownership History
Date
Name
Owned For
Owner Type
Purchase Details
Closed on
Nov 22, 2004
Sold by
West Suburban Bank
Bought by
Ramires Candace
Current Estimated Value
Home Financials for this Owner
Home Financials are based on the most recent Mortgage that was taken out on this home.
Original Mortgage
$145,800
Outstanding Balance
$71,098
Interest Rate
5.75%
Mortgage Type
Unknown
Estimated Equity
$152,240
Purchase Details
Closed on
Aug 22, 2000
Sold by
West Suburban Bank
Bought by
Stratz Richard J and Stratz Anne Marie
Home Financials for this Owner
Home Financials are based on the most recent Mortgage that was taken out on this home.
Original Mortgage
$78,400
Interest Rate
8.94%
Create a Home Valuation Report for This Property
The Home Valuation Report is an in-depth analysis detailing your home's value as well as a comparison with similar homes in the area
Home Values in the Area
Average Home Value in this Area
Purchase History
| Date | Buyer | Sale Price | Title Company |
|---|---|---|---|
| Ramires Candace | $153,500 | -- | |
| Stratz Richard J | $98,000 | -- |
Source: Public Records
Mortgage History
| Date | Status | Borrower | Loan Amount |
|---|---|---|---|
| Open | Ramires Candace | $145,800 | |
| Previous Owner | Stratz Richard J | $78,400 | |
| Closed | Stratz Richard J | $9,800 |
Source: Public Records
Tax History
| Year | Tax Paid | Tax Assessment Tax Assessment Total Assessment is a certain percentage of the fair market value that is determined by local assessors to be the total taxable value of land and additions on the property. | Land | Improvement |
|---|---|---|---|---|
| 2025 | $4,607 | $18,000 | $3,312 | $14,688 |
| 2024 | $4,607 | $21,500 | $8,000 | $13,500 |
| 2023 | $4,380 | $21,500 | $8,000 | $13,500 |
| 2022 | $4,380 | $21,500 | $8,000 | $13,500 |
| 2021 | $2,437 | $12,103 | $828 | $11,275 |
| 2020 | $2,446 | $12,103 | $828 | $11,275 |
| 2019 | $2,477 | $13,448 | $828 | $12,620 |
| 2018 | $2,583 | $12,679 | $690 | $11,989 |
| 2017 | $2,553 | $12,679 | $690 | $11,989 |
| 2016 | $2,628 | $12,679 | $690 | $11,989 |
| 2015 | $2,584 | $12,000 | $621 | $11,379 |
| 2014 | $2,570 | $12,000 | $621 | $11,379 |
| 2013 | $2,499 | $12,000 | $621 | $11,379 |
Source: Public Records
Map
Nearby Homes
- 633 Dulles Rd Unit A
- 756 W Millers Rd
- 500 W Huntington Commons Rd Unit 448
- 909 S Emerson St
- 380 Dulles Rd
- 381 W Millers Rd
- 601 W Huntington Commons Rd Unit 202
- 915 S Owen St
- 901 S Can Dota Ave
- 725 W Huntington Commons Rd Unit 401
- 301 Lance Dr
- 304 E Hiawatha Trail
- 407 E Berkshire Ln
- 170 Westmere Rd
- 1100 S Church Rd
- 930 Beau Dr Unit 312
- 960 Beau Dr Unit 109
- 147 Lance Dr
- 650 Murray Ln Unit 214
- 650 Murray Ln Unit 314
- 695 Dulles Rd
- 695 Dulles Rd
- 695 Dulles Rd
- 695 Dulles Rd Unit C
- 711 Dulles Rd Unit F
- 711 Dulles Rd
- 711 Dulles Rd
- 711 Dulles Rd
- 711 Dulles Rd
- 711 Dulles Rd
- 711 Dulles Rd
- 711 Dulles Rd Unit E
- 645 Dulles Rd Unit 645B
- 645 Dulles Rd Unit 645A
- 645 Dulles Rd Unit A
- 641 Dulles Rd Unit 641B
- 641 Dulles Rd Unit 641A
- 641 Dulles Rd
- 641 Dulles Rd Unit B
- 637 Dulles Rd Unit 637B
Your Personal Tour Guide
Ask me questions while you tour the home.